The custom charts feature allows you to create charts from one or more data sources. You can choose from 15 chart types and configure them to suit your needs.
This guide shows you three different ways to create custom charts in Screenful using data from Jira, Trello, Linear, GitHub, GitLab, monday.com, and Asana..
Create a chart from a template
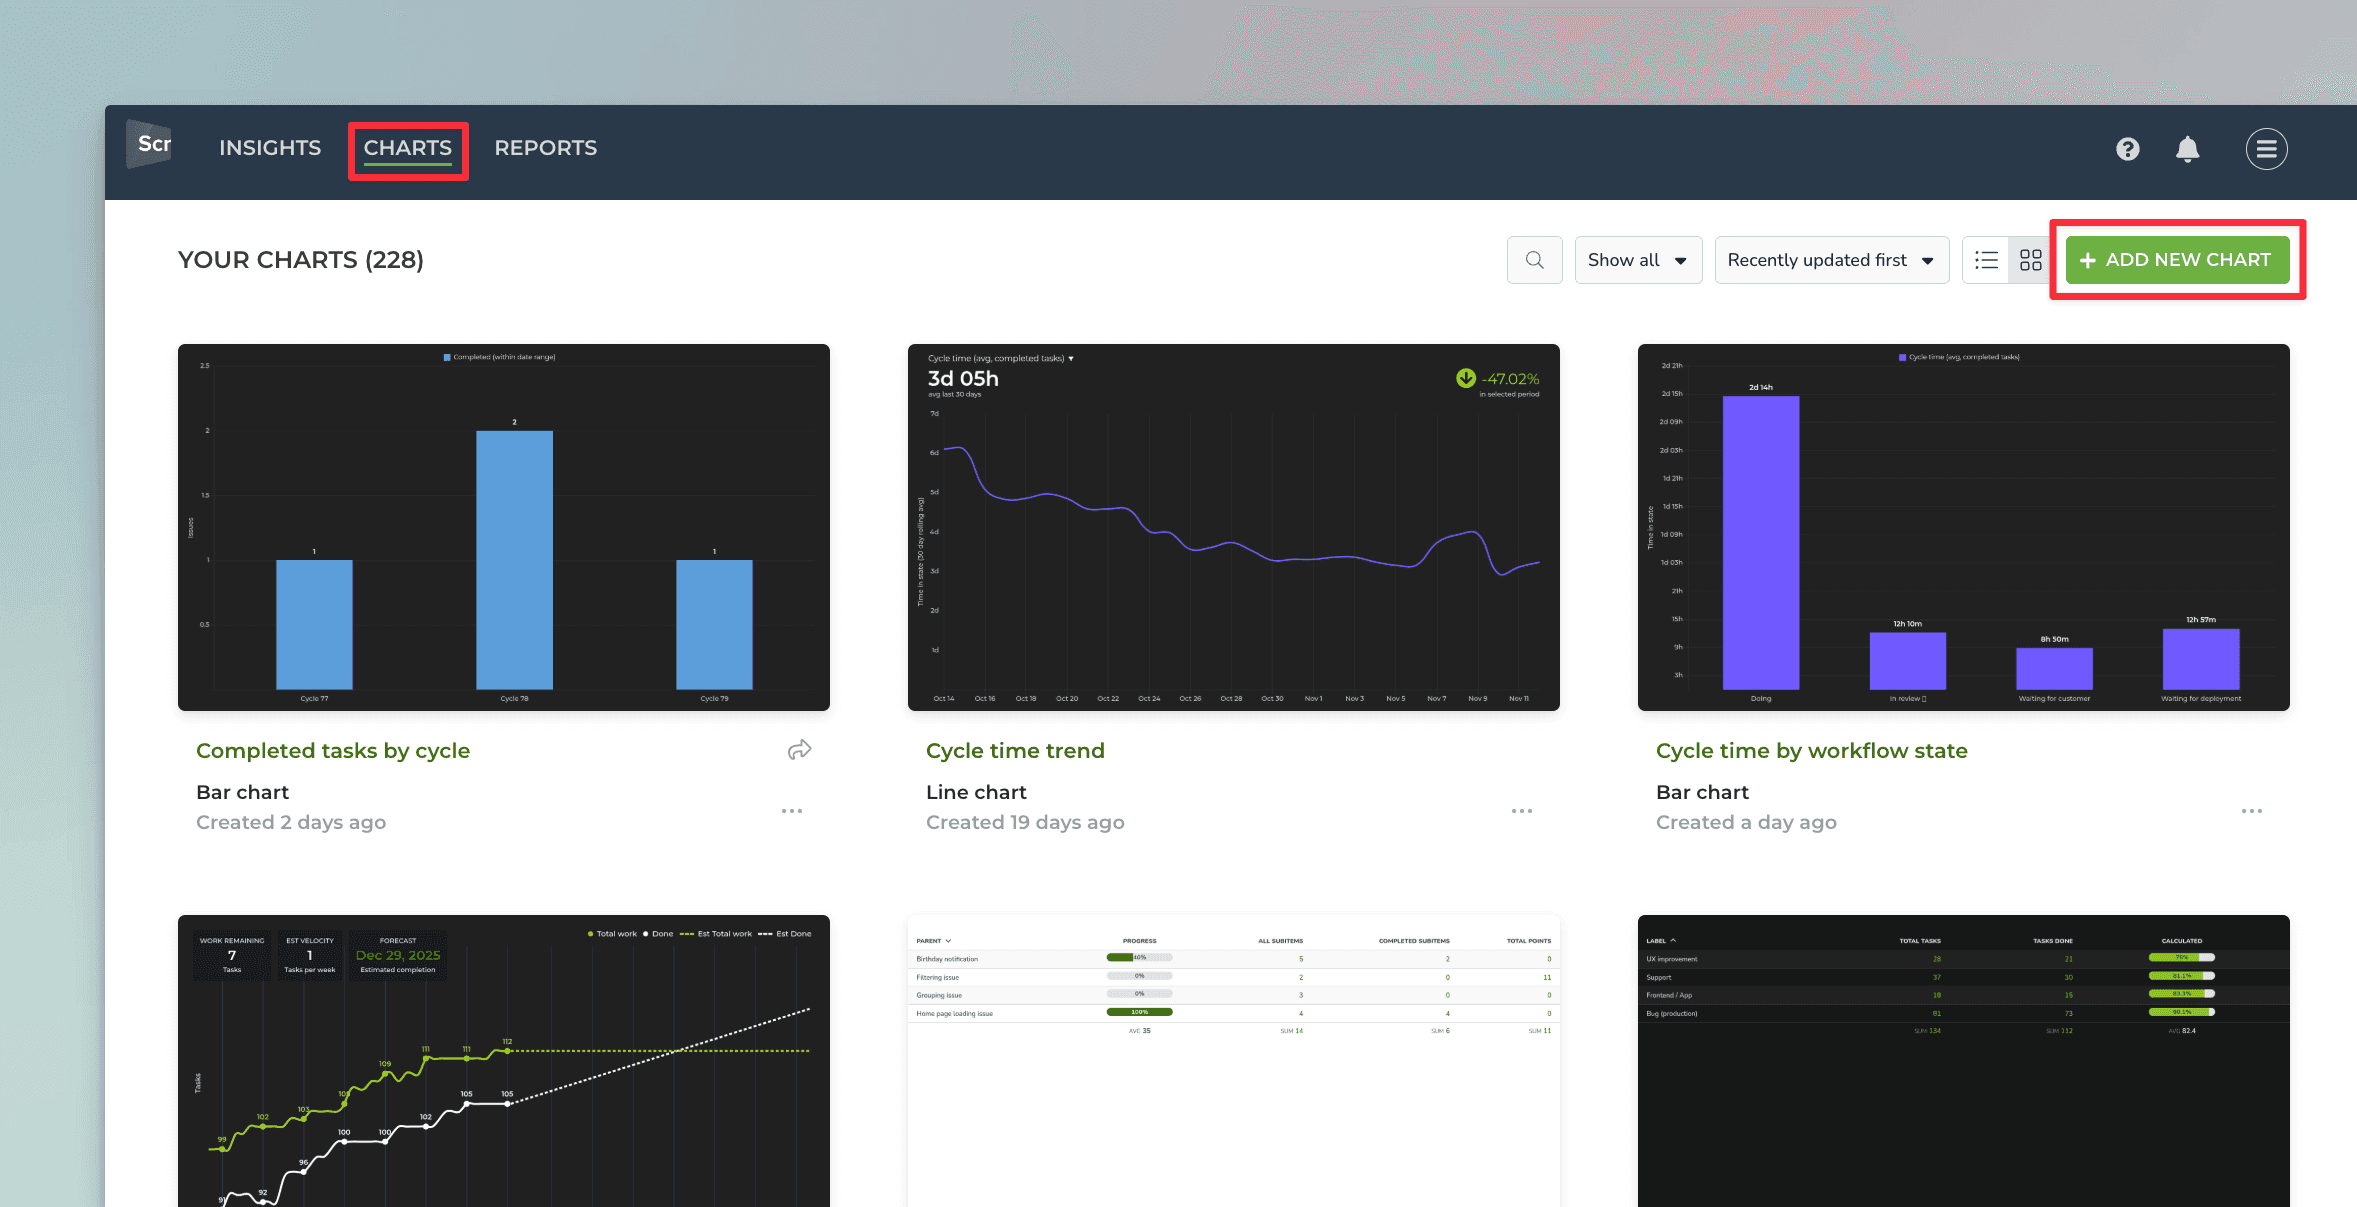
To create a custom chart from a template, go to the Charts tab and click Add new chart in the top right corner.
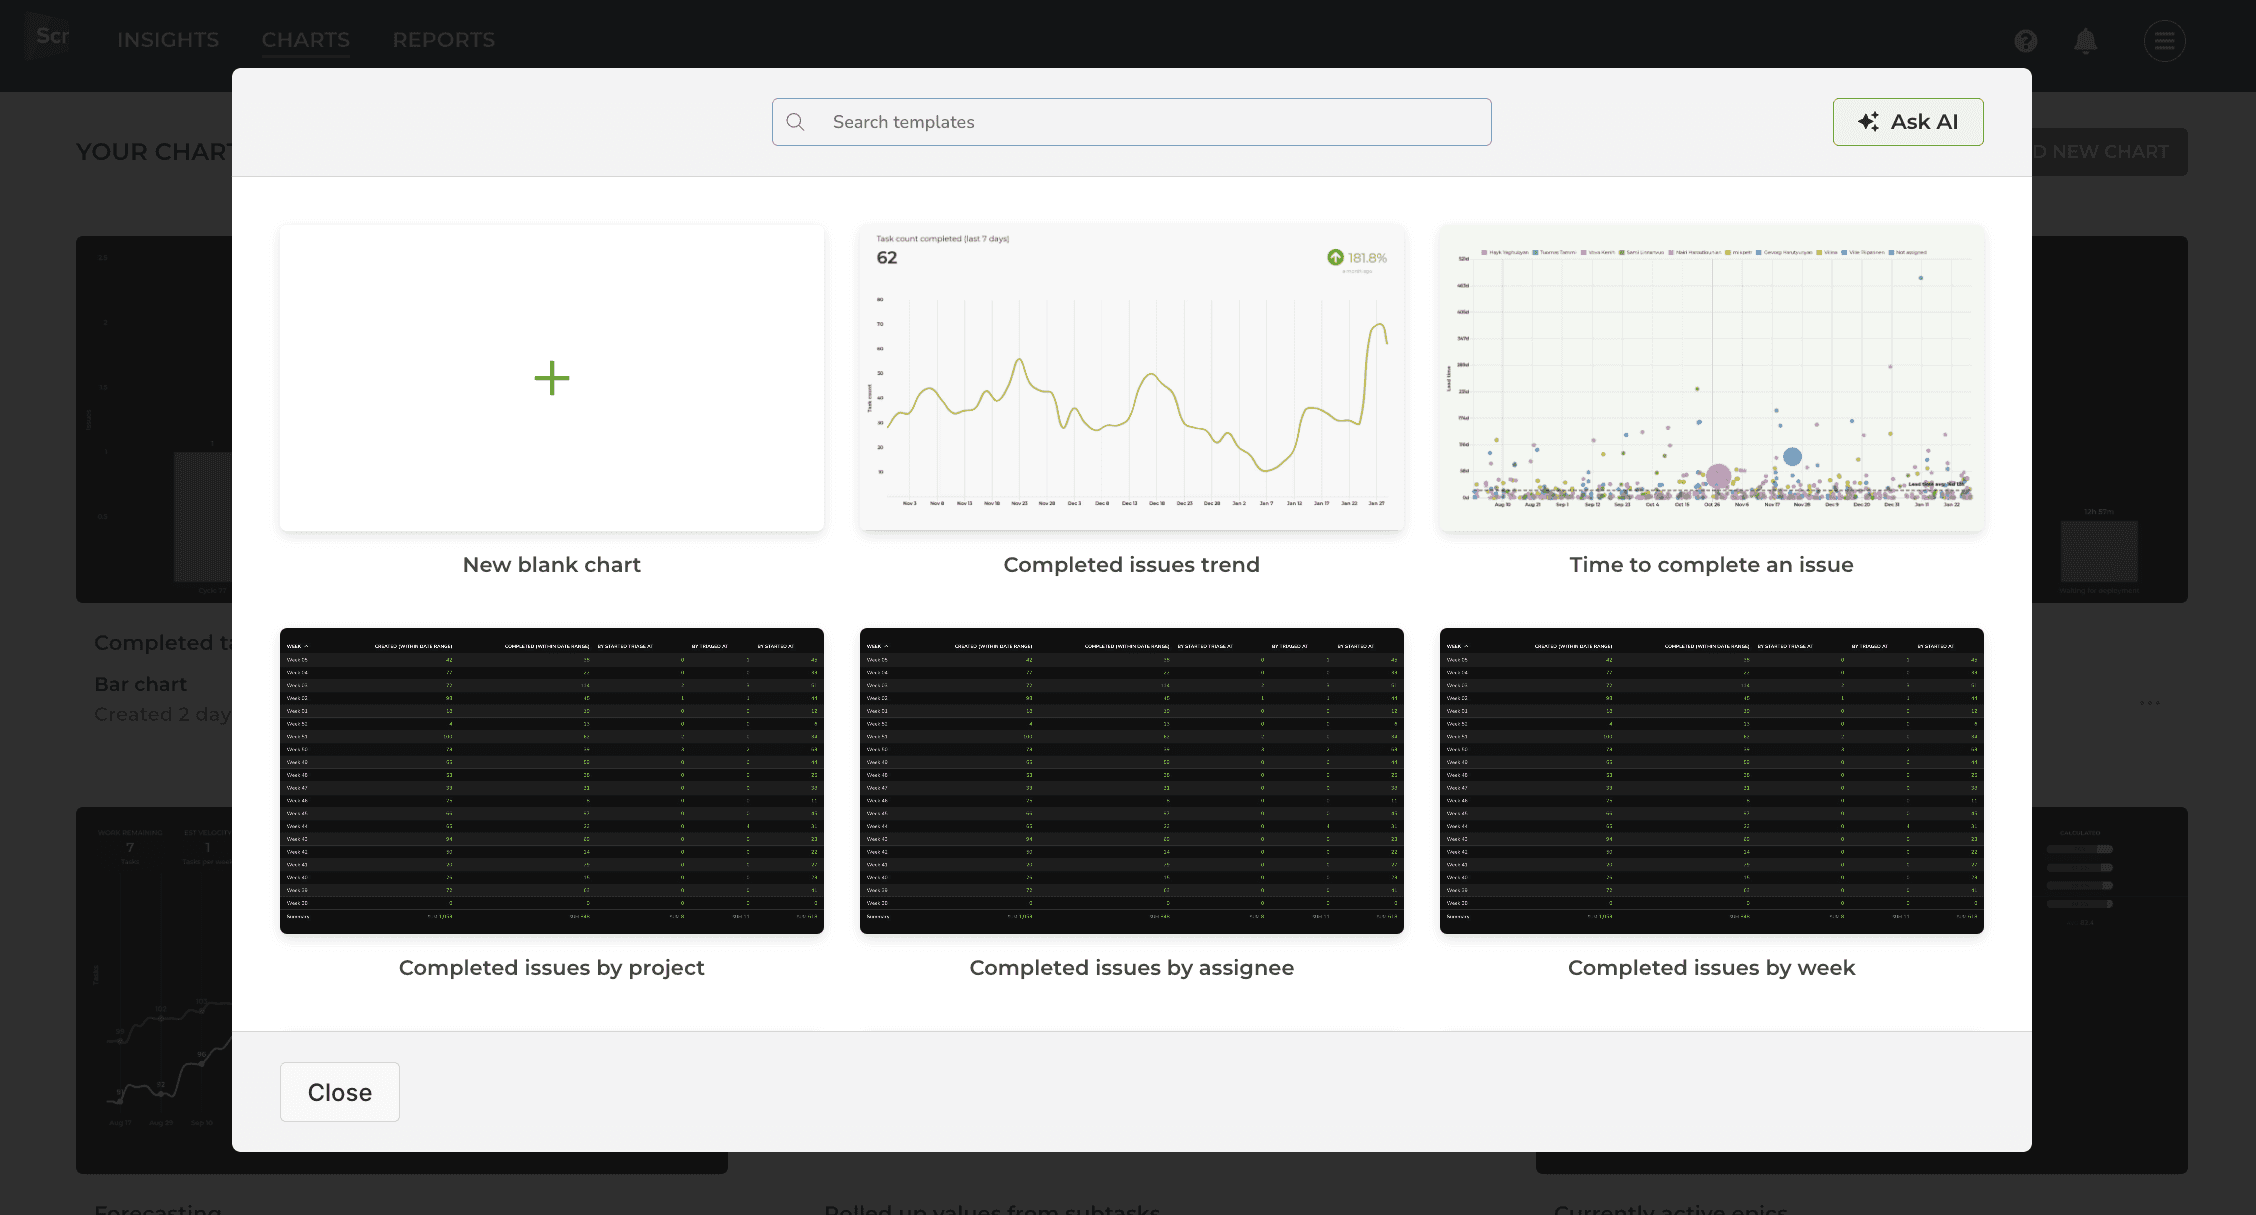
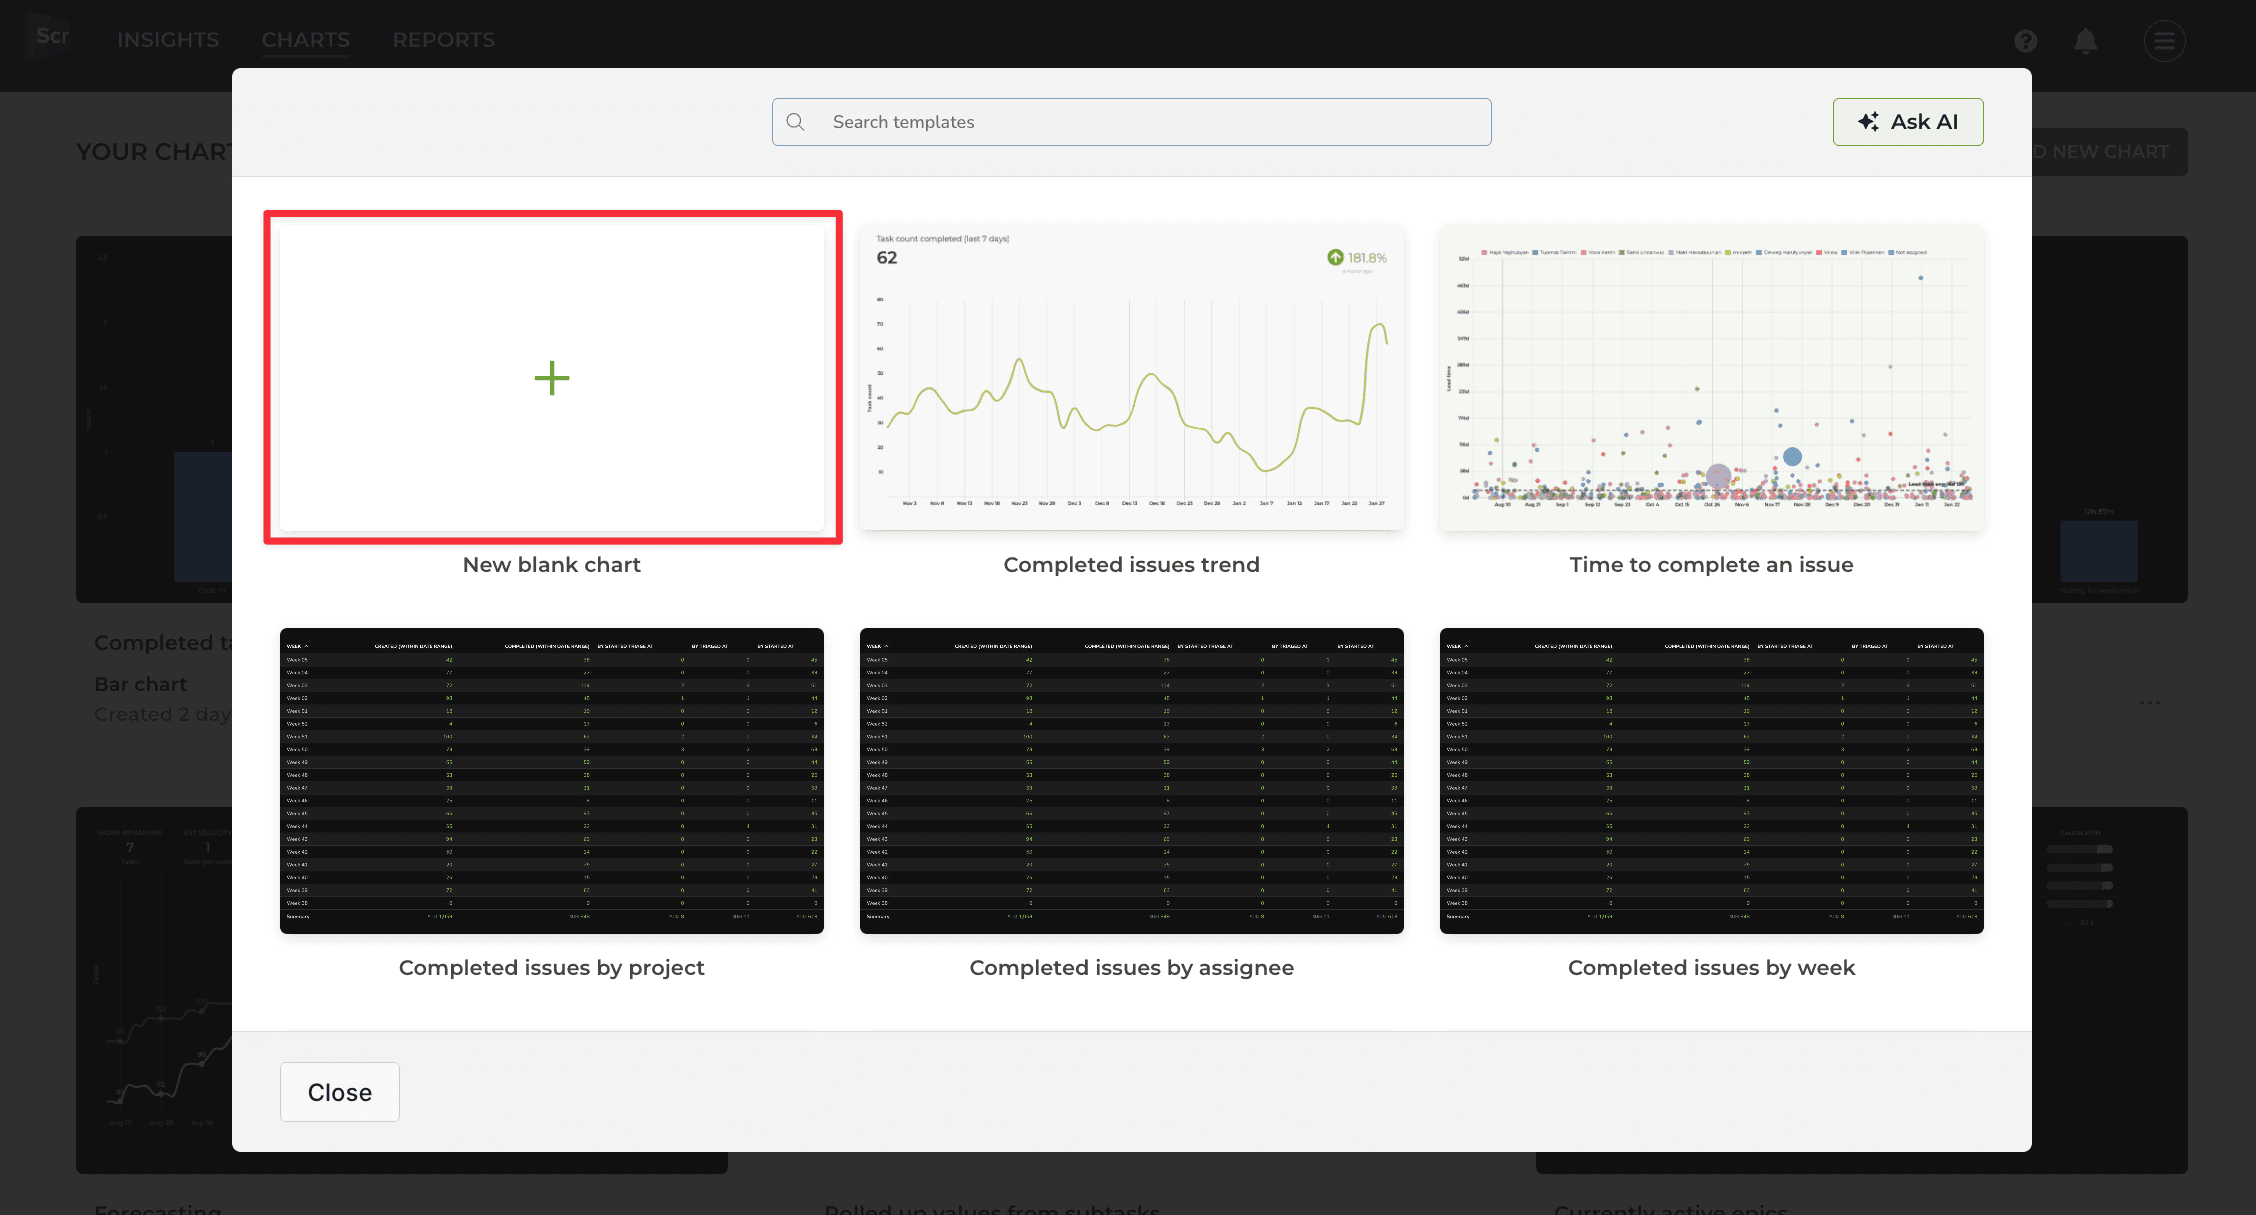
A modal is opened with a set of chart templates. You can either create a new chart from scratch or pick one of the predefined charts.
Clicking a chart template opens a preview with real data. You can select the data sources from the Data sources menu above the chart. You can pick one or more data sources for your chart and see the results immediately.
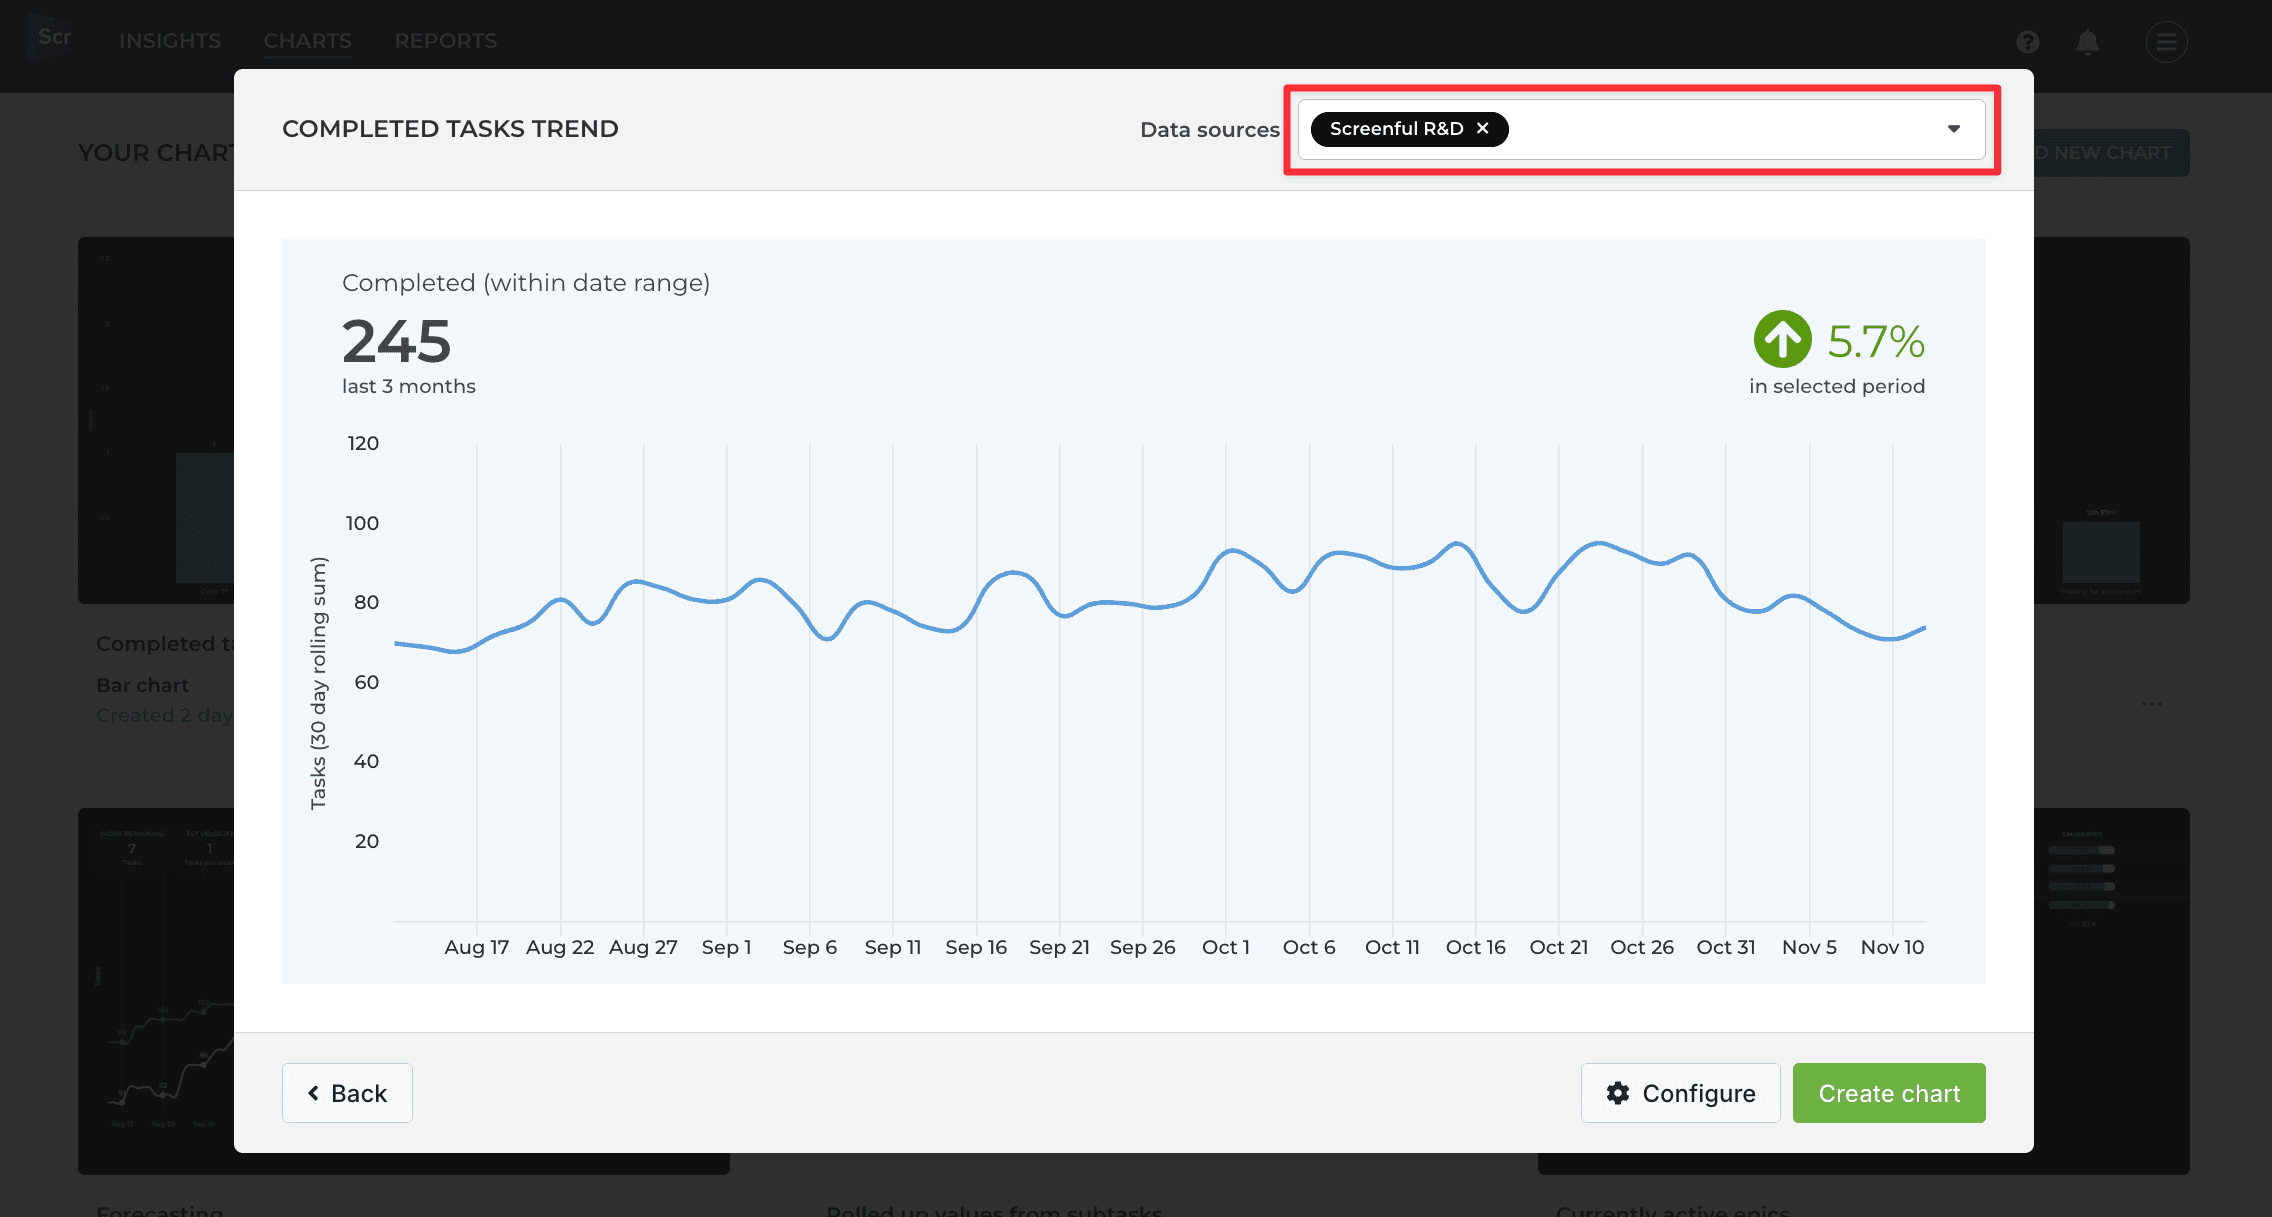
The template comes with predefined settings. If you're happy with the chart, you can click Create chart to save it under the Charts tab.
To adjust the settings, click Configure to open the chart for editing.
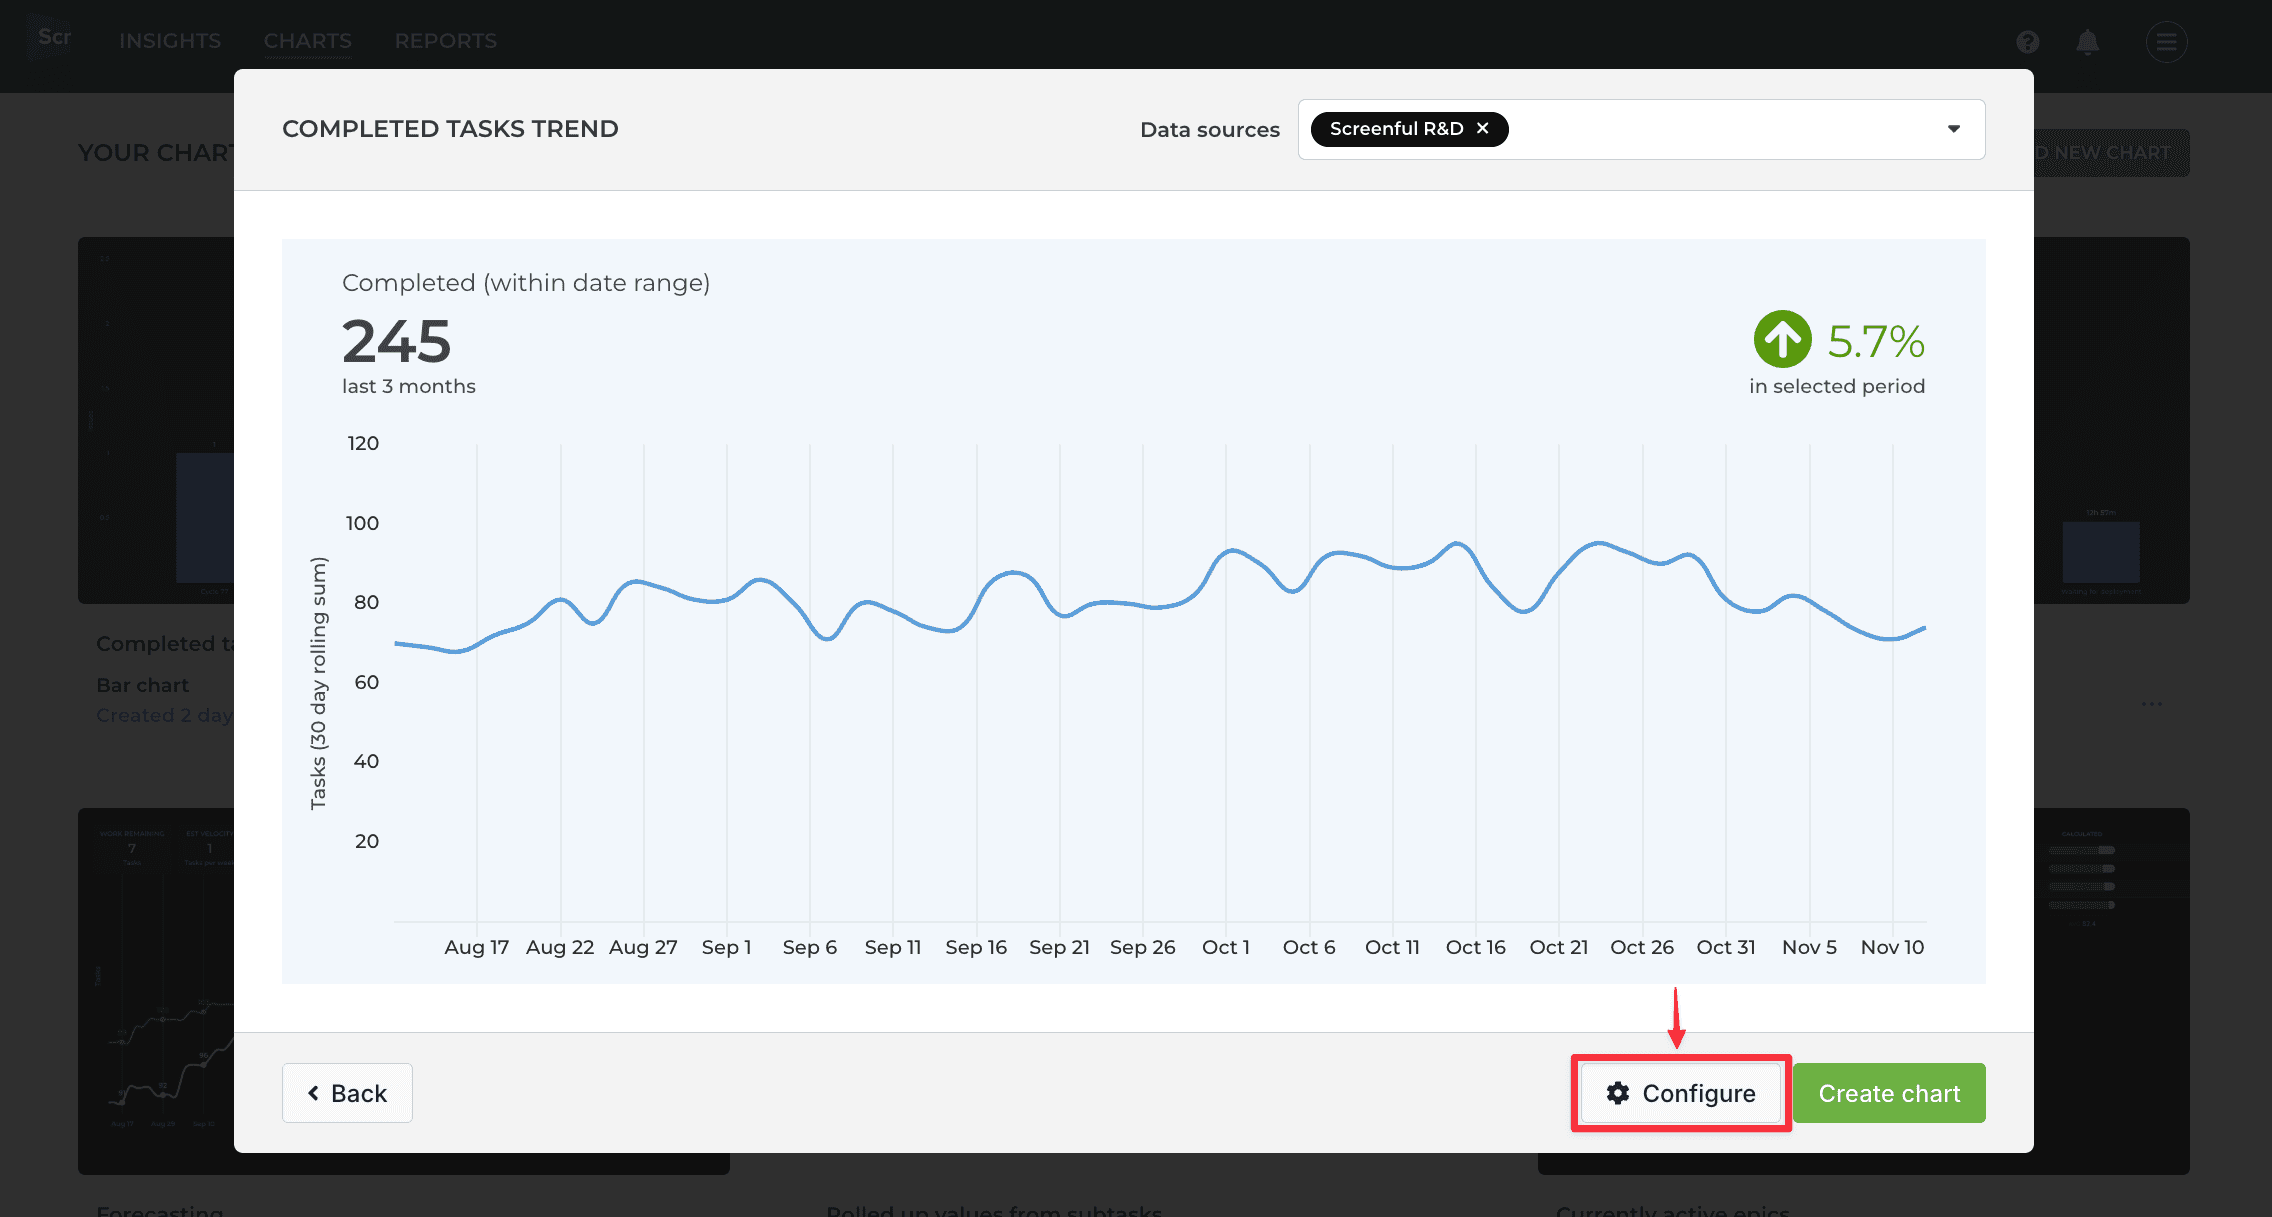
The chart editor opens, revealing the chart settings. If the chart is anywhere close to what you’re looking for, you should be able to make it perfect with just a few adjustments.
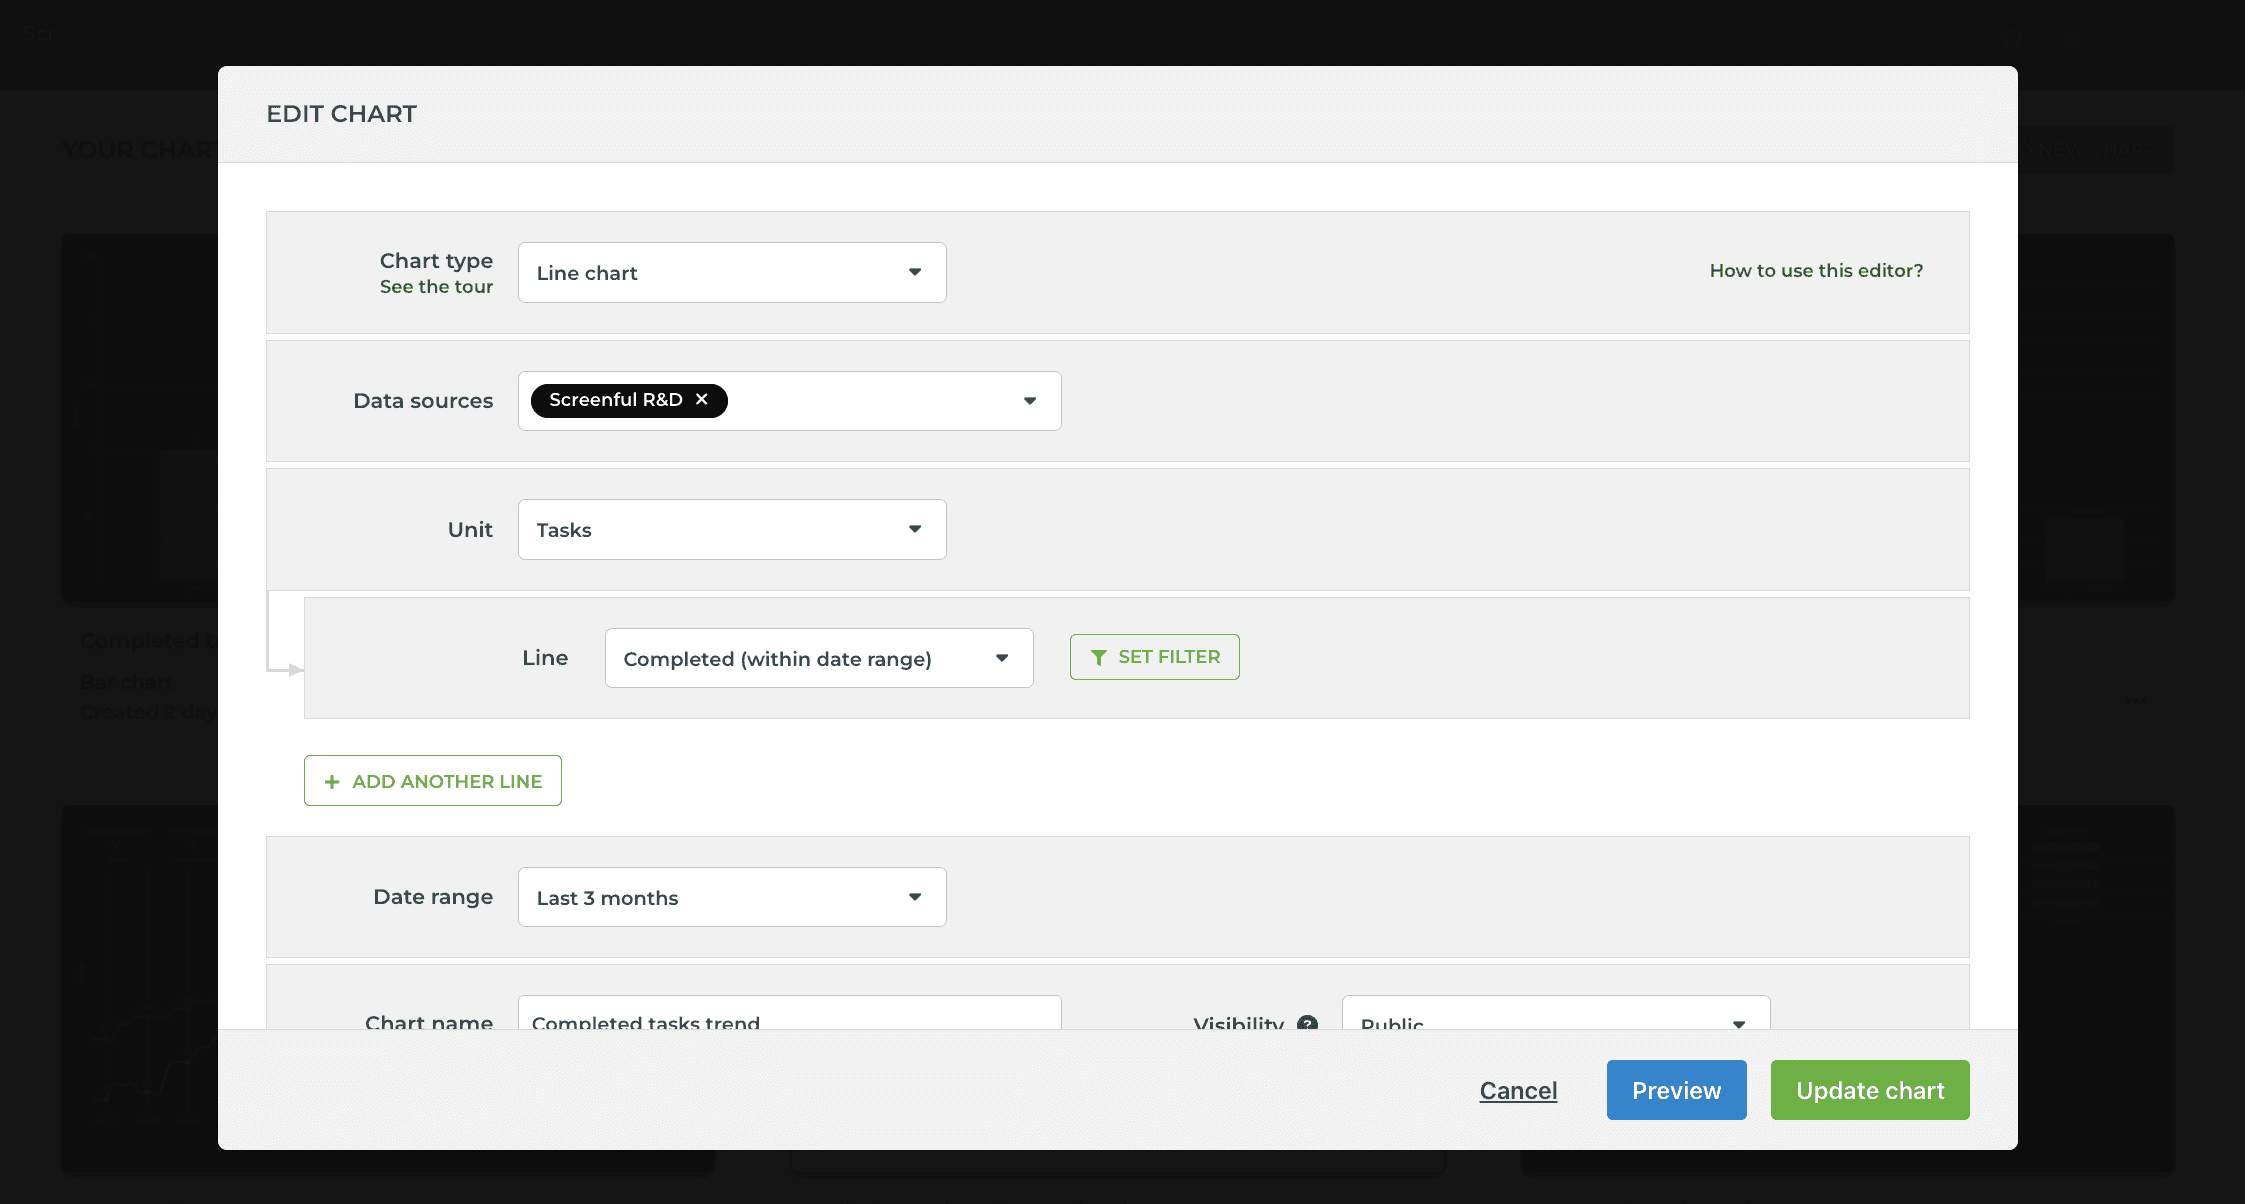
You can adjust the name, unit, metrics, date range, and set filters.
When you click Create chart, the chart is created and you can find it under the Charts tab under the main navigation.
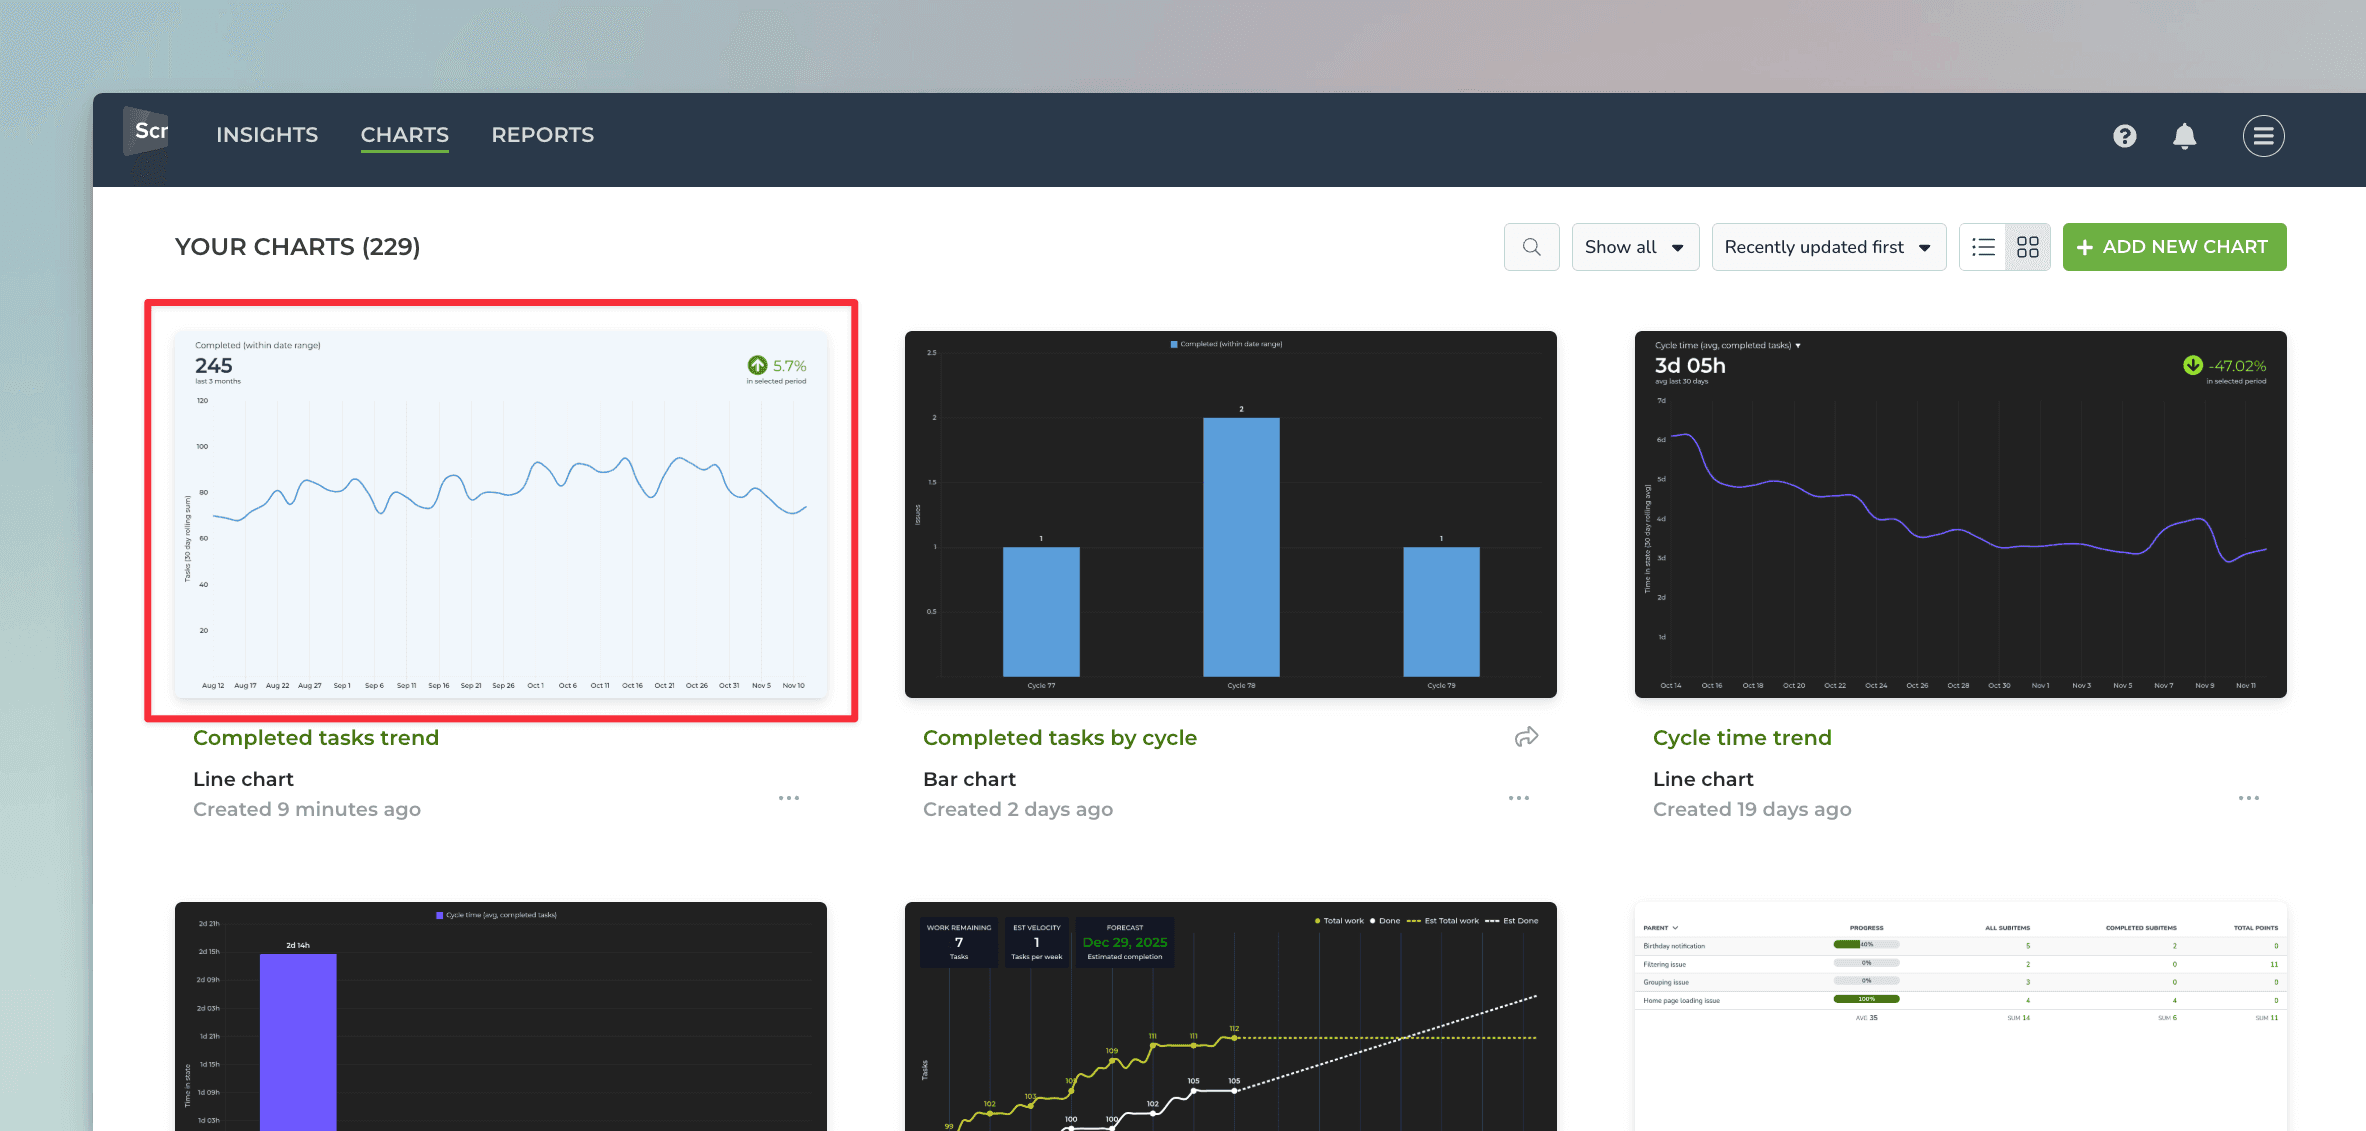
From there, you can assign it to a report or share it with others using the share links.
Create a chart with the editor
While chart templates can get you started quickly, the chart editor allows the flexibility to create the exact chart you're looking for. To create a custom chart using the chart editor, go to the Charts tab and click Add new chart in the top right corner.
In the modal, select New blank chart:
The chart editor opens, allowing you to select the chart type and the settings for the chart:
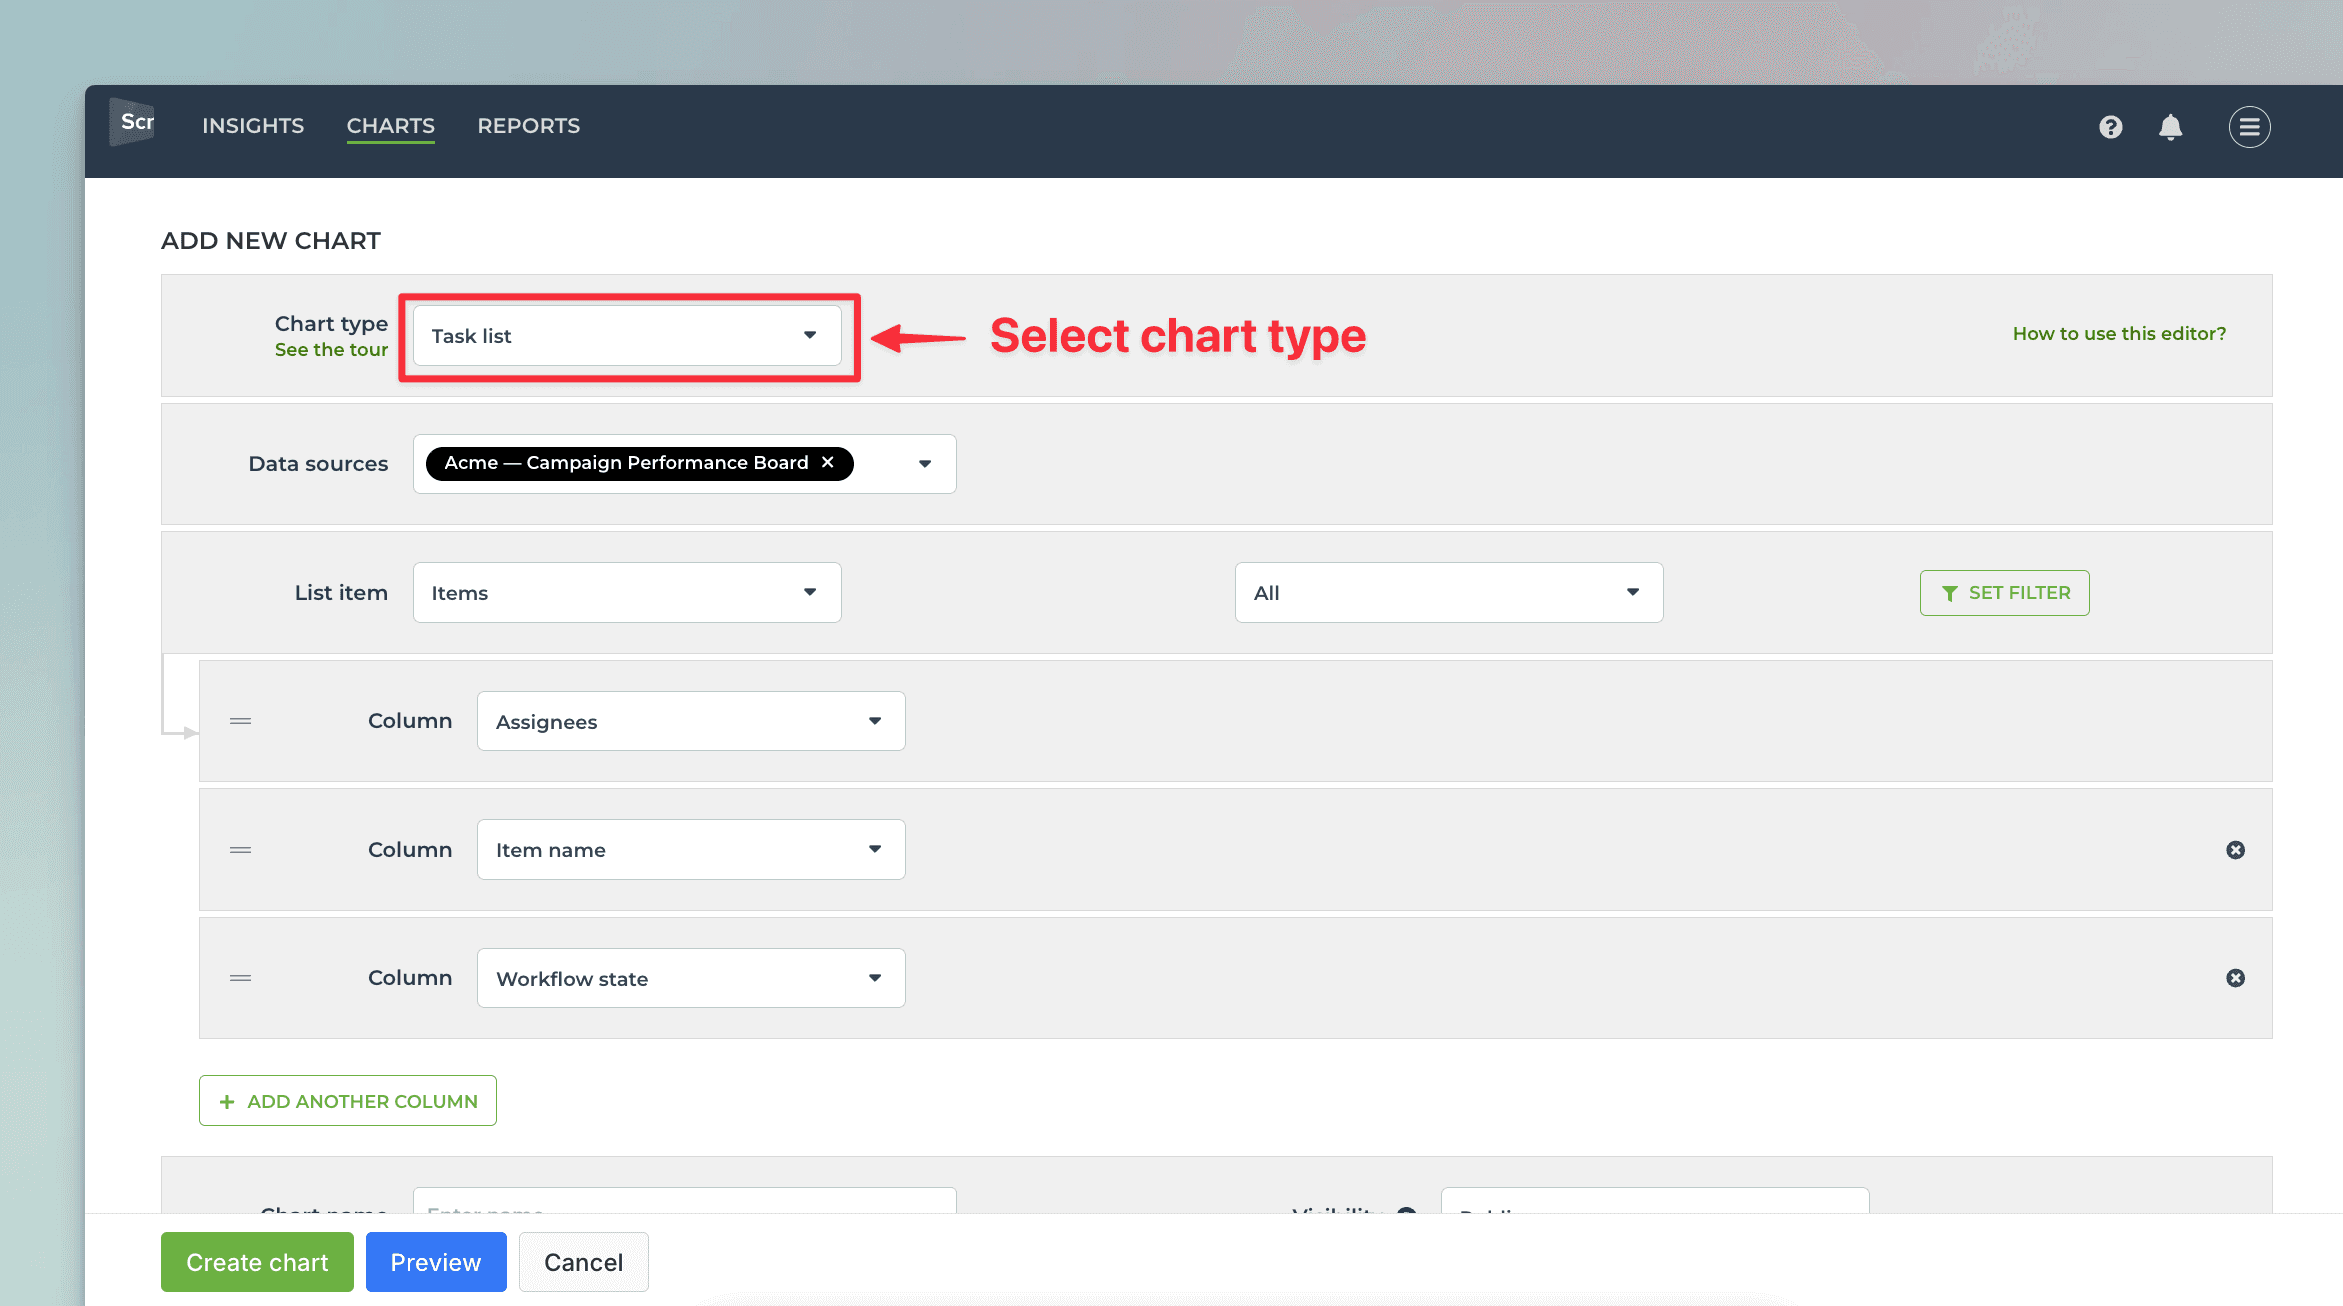
The settings depend on the selected chart type. You can adjust the settings and use the Preview feature to see the result.
Once you are happy with the result, you can click Create chart to save the chart under the Charts tab.
You can further customize the chart by selecting the Chart settings from the three dots menu:
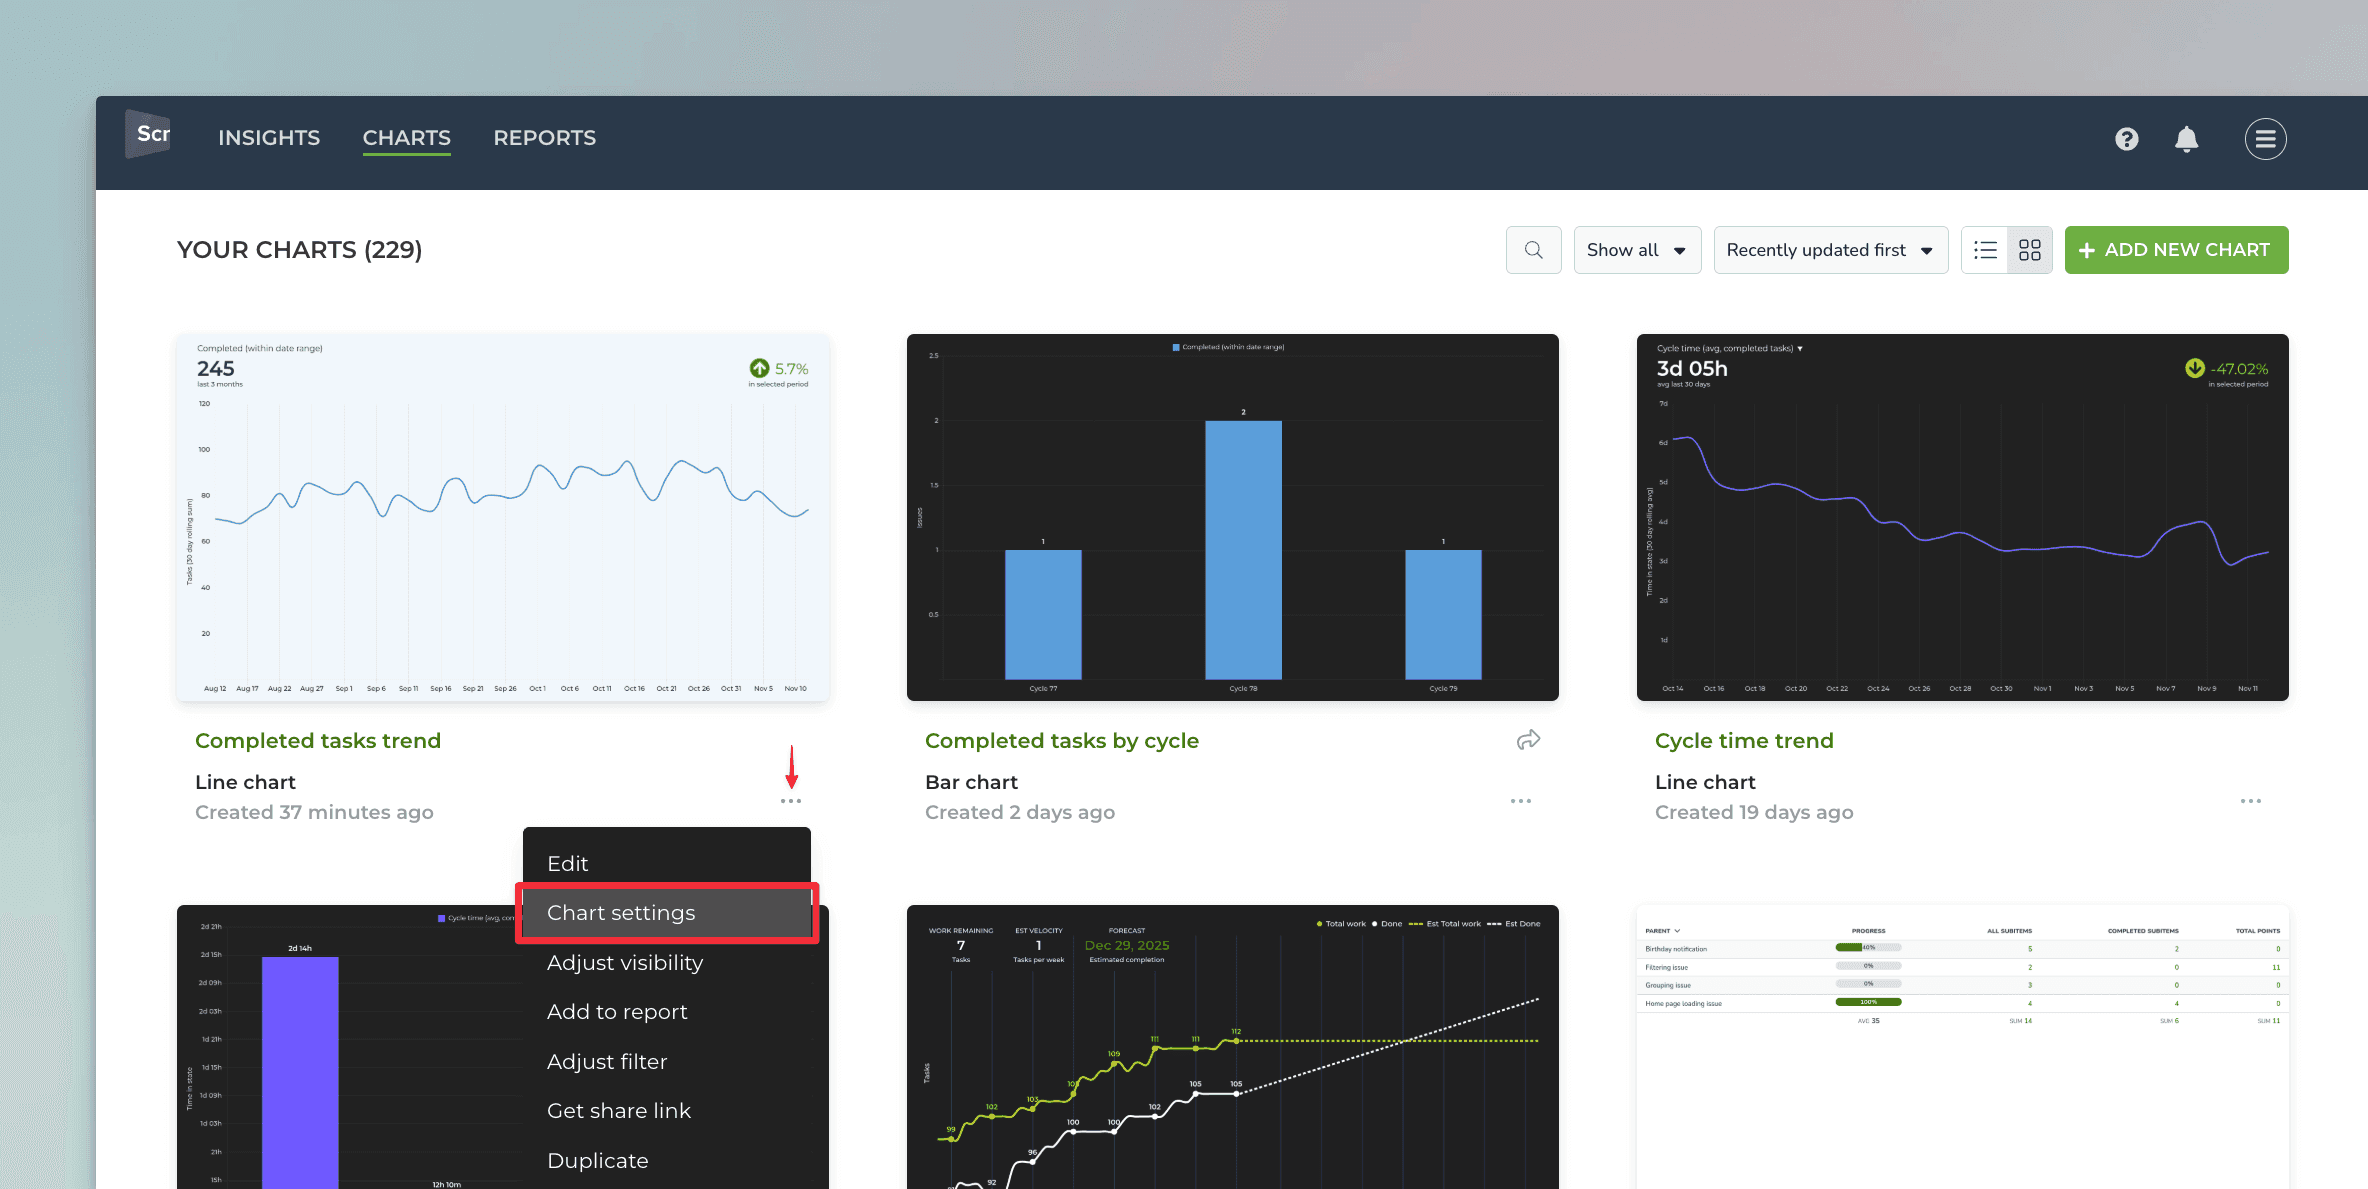
In the Chart settings, you can rename labels, set visibility, quick filters, and many other things depending on the chart type.
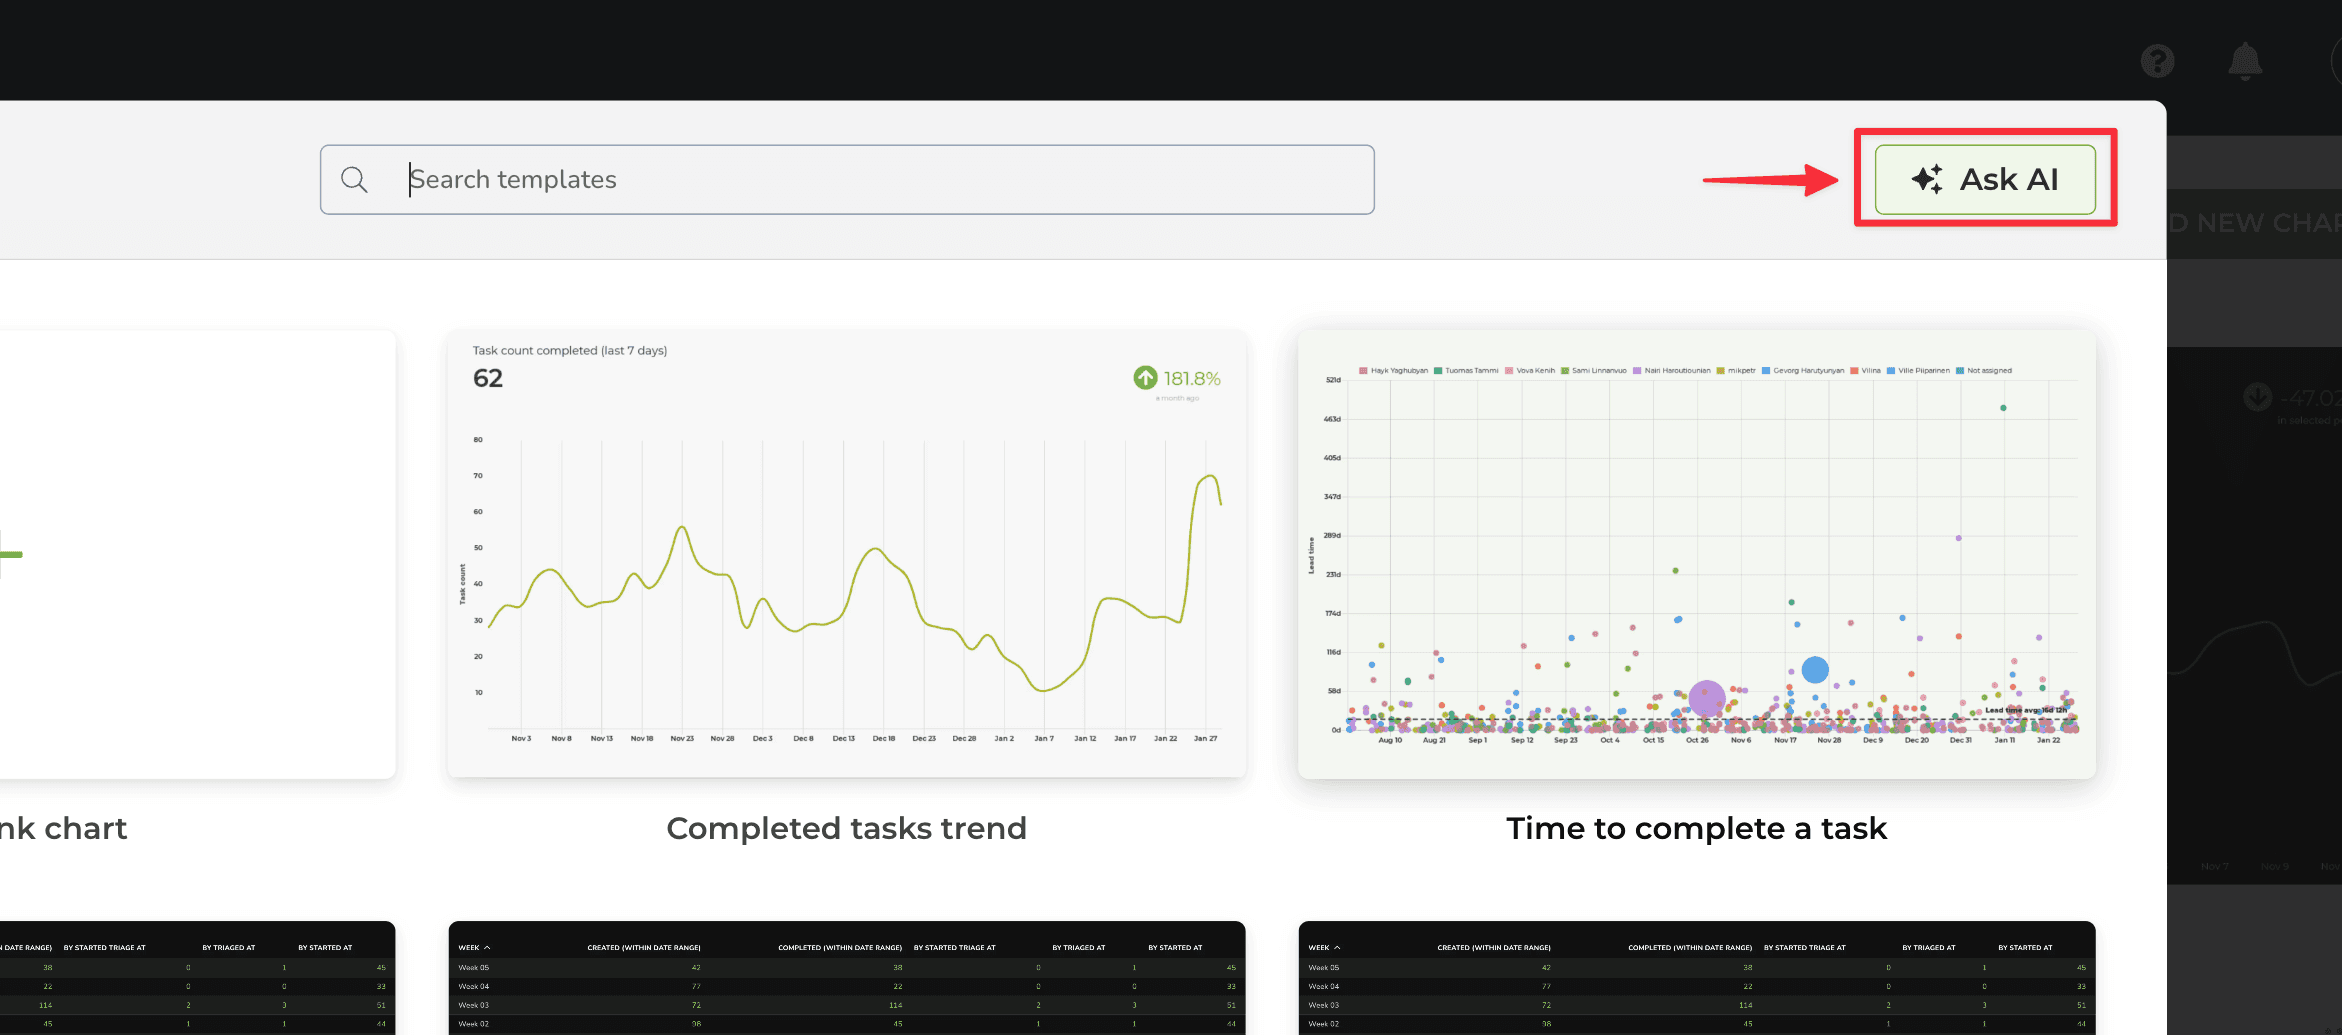
Create a chart with the AI assistant
The AI assistant can be launched from the charts modal by clicking the Ask AI button on the top right corner:
A chat view opens, and you can start chatting with the assistant:
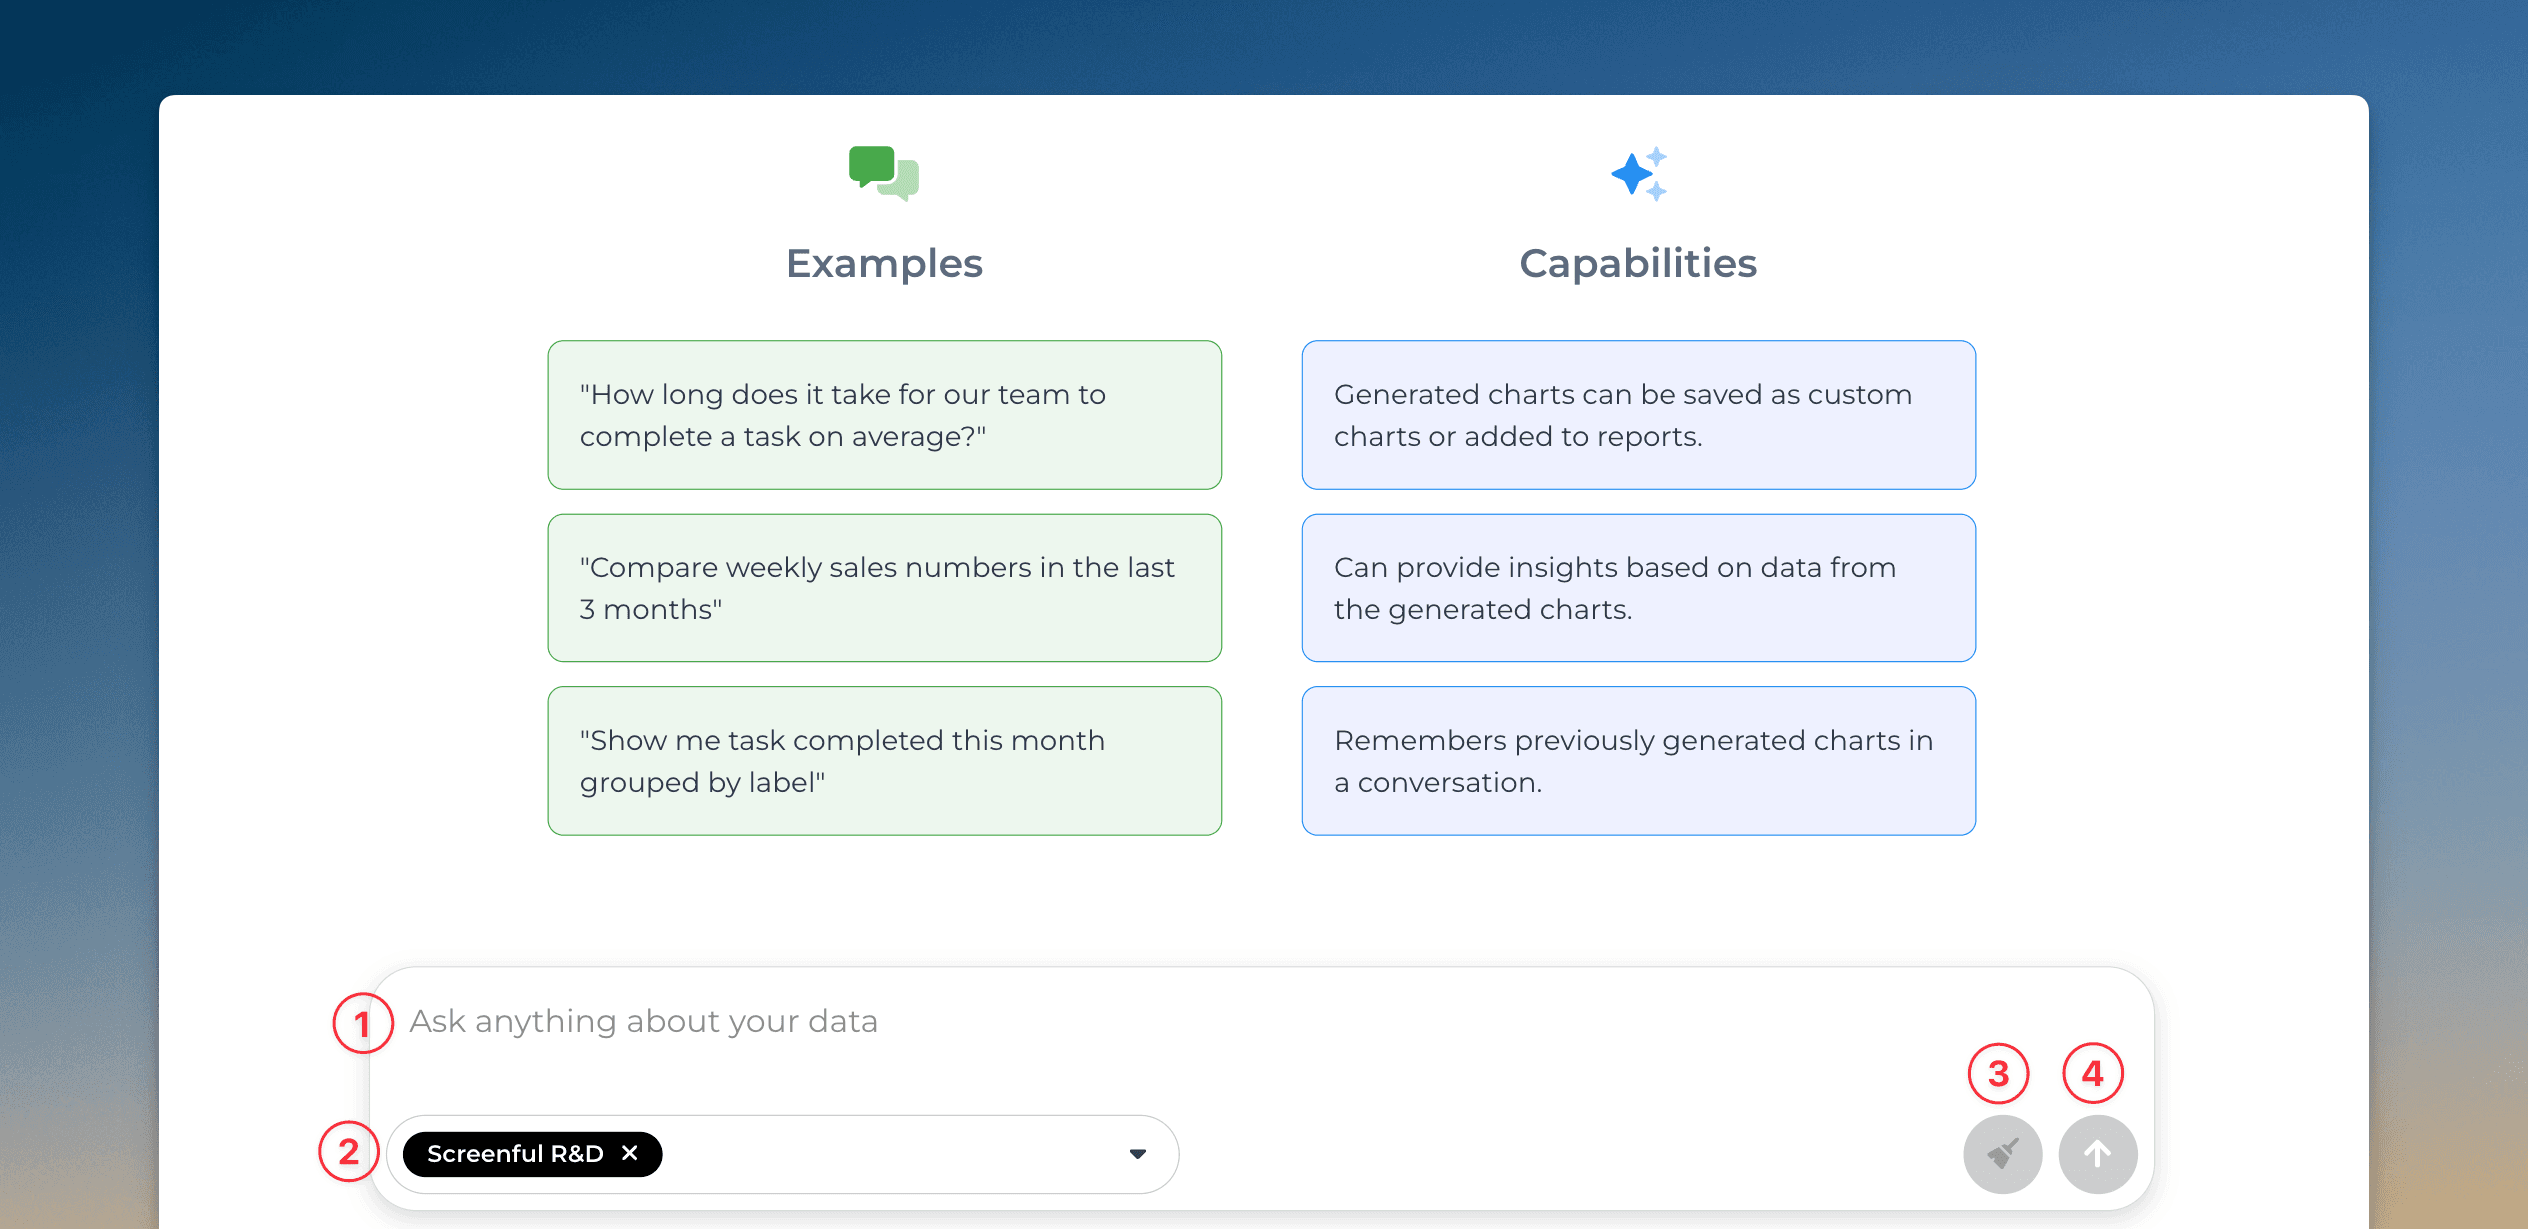
The numbered elements are:
Enter a prompt in a natural language (in English or your native language)
Select data sources from the drop-down menu.
Clear chat history. Removes chats and makes the assistant forget previous prompts.
Send message (same as pressing the enter key)
You can create a chart by describing it in natural language (any language). You can ask questions like
"Show me task completed this month grouped by label"
"Compare weekly sales numbers in the last 3 months"
"How long does it take for our team to complete a task on average?"
If the assistant understood your prompt, you should see a chart as a result. You can refine the chart with further asks:
"Switch the colors of the bars to blue and change the grouping to assignee"
The assistant adjusts the chart according to your request. You can always undo the latest change and try again with a different prompt.
At any time, you can open the chart for editing by clicking Edit below the chart. The chart editor is opened, and you can adjust the chart configuration.
Clicking Save below the chart saves it, and you can find it in the Charts tab.
Learn more
Book a free onboarding call
Need help with setting up your charts and reports? Don't find a metric you are looking for? Book a call with our expert. We'd love to help you supercharge your reporting!


