Want to filter the contents of charts? We've got you covered since you can filter charts by any available property such as assignee or label. You can also filter by your custom fields. This guide teaches you how to use filters like a pro!
Guide contents:
How to find the filter feature?
Each chart has its own filter. Therefore, to filter the contents of a report, you need to open an individual chart for editing, and then adjust the filter by clicking Set filter in the chart editor:

When you are editing a report under the Reports tab, you access the filter of an individual chart by clicking the Edit chart icon next to the three dots menu:

When you are in the Insights tab, you can filter all the charts at once by clicking the Set filter button on the top toolbar:

Note that when you set a filter in the Insights tab, it only affects what you see. Other users have their own filter.
When you click the Set filter button in any of those views, the same filter modal is shown:

In the filter modal, you can set filters such as label include “bug” or label does not include “bug”. You can also do more complex filters involving number comparisons, date comparisons, etc.
If you add new custom fields to your board, they will be automatically imported and made available for filters after the next data sync (data is synced once per hour). You can trigger sync manually at the integration settings.
Filtering by assignee, label, board, project, etc.
You can filter by any of the task properties available in your data such as assignee, group, label, board, project, sprint, milestone etc.
The available filters depend on the data source. The common filter for all data sources include assignee, label/tag, data source, workflow state, and mapped state. Depending on the data source, you can also filter by project, section, group, sprint, epic, milestone, version etc.
You can set multiple filters by selecting them one by one. Each filter can have multiple options for is any of or is none of.
Once you have set the filters, click Save to apply the filter to the chart.
Filtering by number fields
You can filter charts by any of your number fields. You can find them in the filter options, and you can do comparisons such as is greater than or is less than:

You can also filter by exact match using is equal to or is not equal to:

You can also filter by which items have a value or do not have a value by selecting is empty or is not empty:

Filtering by date fields
You can filter a chart by any of your date fields. When you select a date field in the filter, you can select within the last, not within the last, within the next or not within the next and enter the number of days:

In the above example, the filter will include items items with Date created within the last 10 days.
Alternatively, you can select before or after, and use the date picker to select the date:
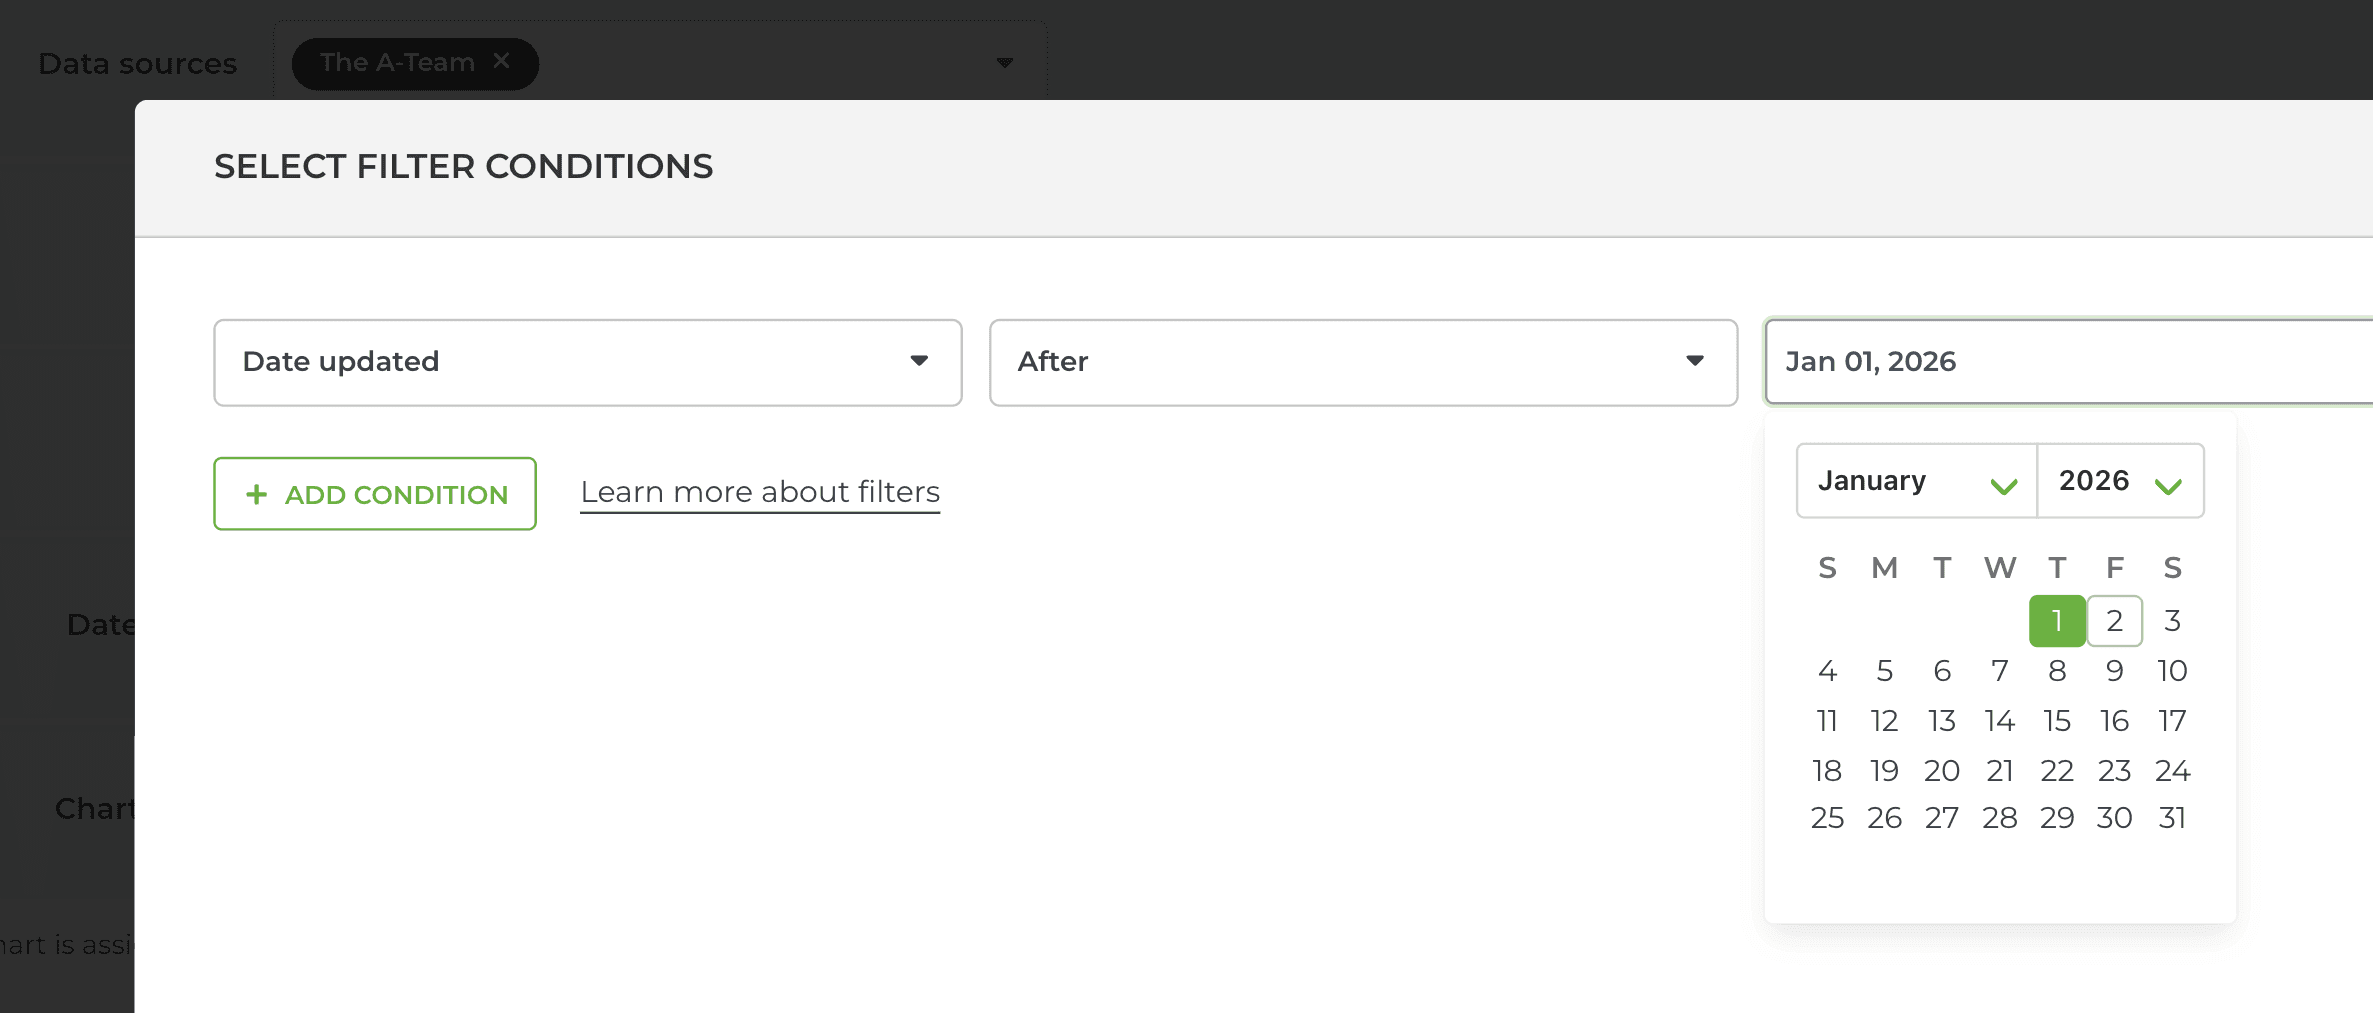
That will select all items with Date updated after the selected date. You use any of your date fields in the filter, including any of your custom date fields.
Filtering by text fields
You can add any of your text fields as columns to the Taks list. However, a lesser-known fact is that you can also use them for grouping and filtering data.

Before you can use your custom text fields in grouping and filtering, you need to map them as Group & filter first.
Filtering by substring
You can filter by partial text match using Contains or Doesn't contain. You can type the phrase in the filter window. It will be matched against the selected field, such as Label:

Selecting Label Contains "Bug", filters all items that have the characters "Bug" as part of the label name. That would include labels such as "Bug production" and "Bug staging".
You can enter multiple keywords by using the pipe "|" character as a separator:
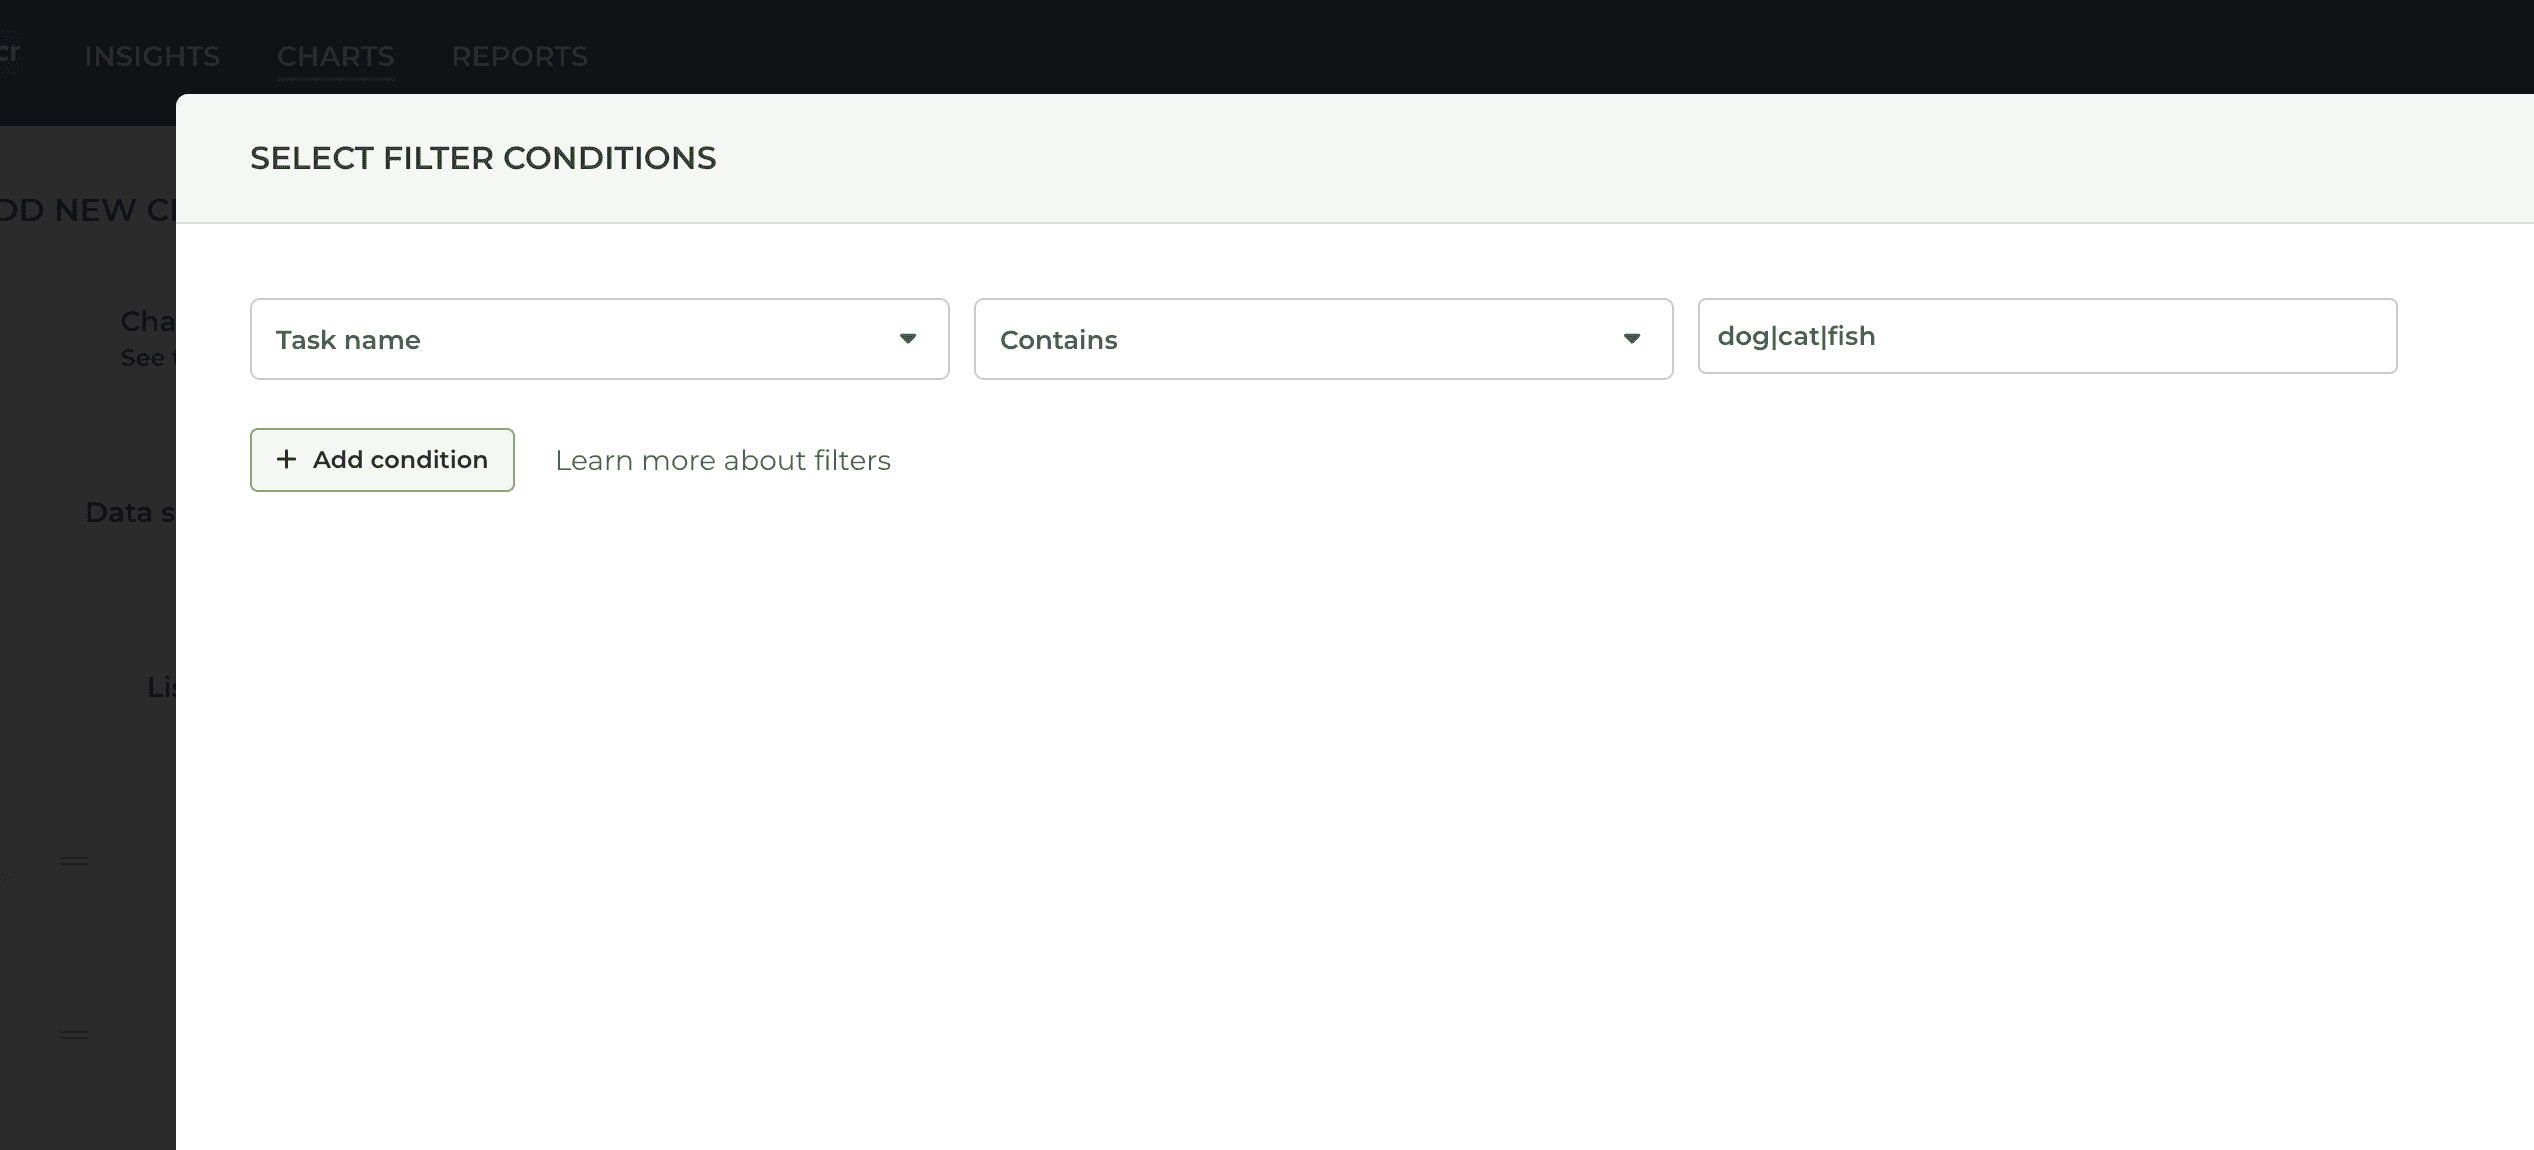
For example, searching "dog|cat|fish" would match all items with the word "dog", "cat", or "fish" in the task name.
Filtering by task name
You can filter by the name of the item (issue/task/story, etc.) by selecting Item name from the filter menu.

You can enter the full name of the item, or use a substring of the name to include or exclude specific items from the set.
You can enter multiple keywords by using the pipe "|" character as a separator:

For example, searching "dog|cat|fish" would match all items with the word "dog", "cat", or "fish" in the task name.
Filtering by timings
You can filter by timings such as total time in progress (cycle time), time in a workflow state, or time logged to a time tracking field.
To find items that have been in progress for longer than a certain number of hours, select Time in progress from the filter menu:
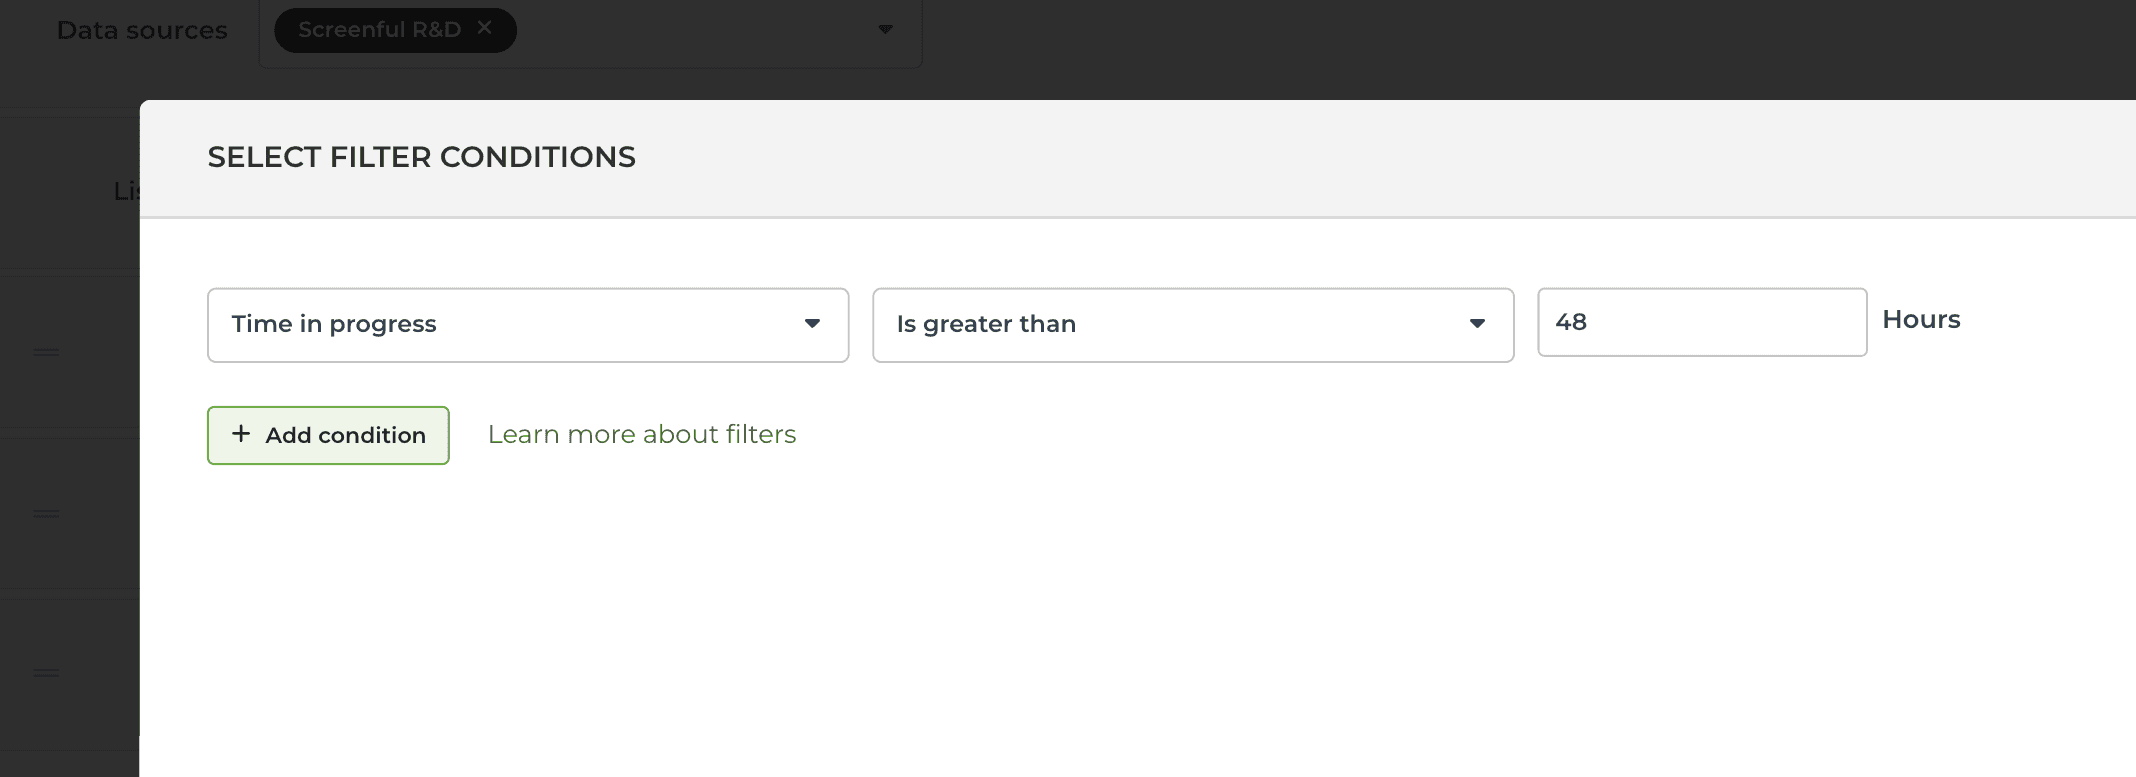
Select Is greater than from the second menu and enter the number of hours in the input field.
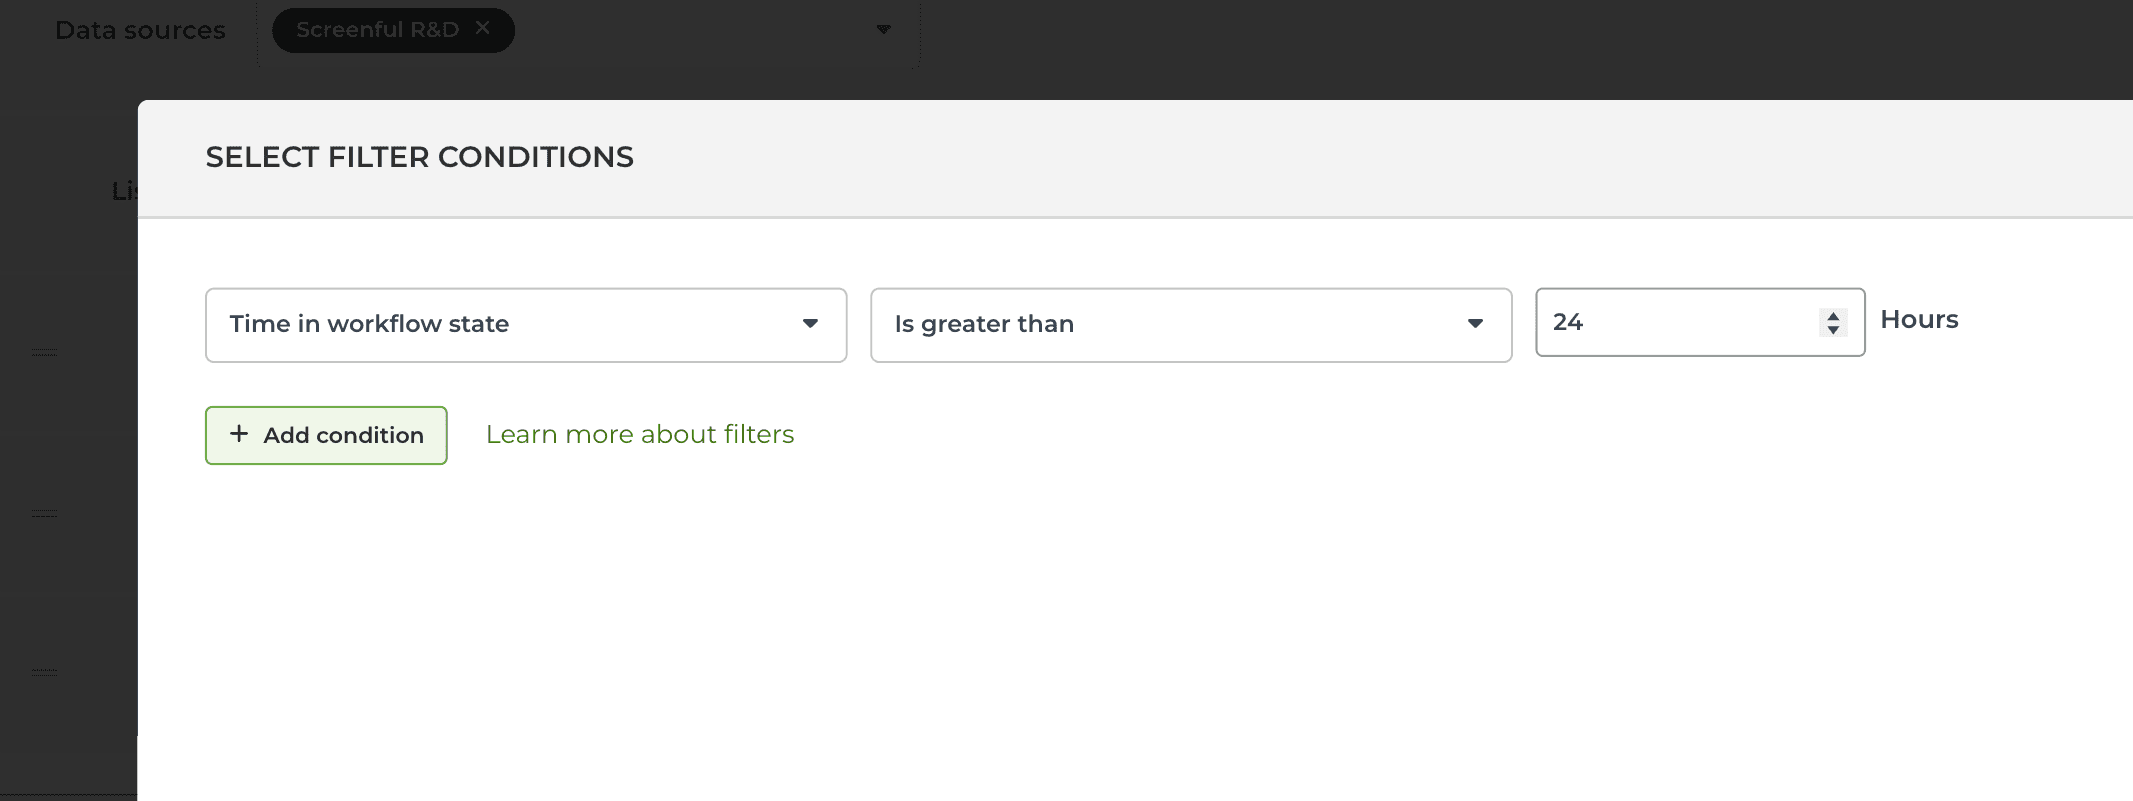
To find items that have been in their current workflow state for longer than a certain number of hours, select Time in workflow state:
To find items that have spent longer than a certain number of hours in a specified workflow state (in the past), you can set a filter like this in the Scatter plot chart:
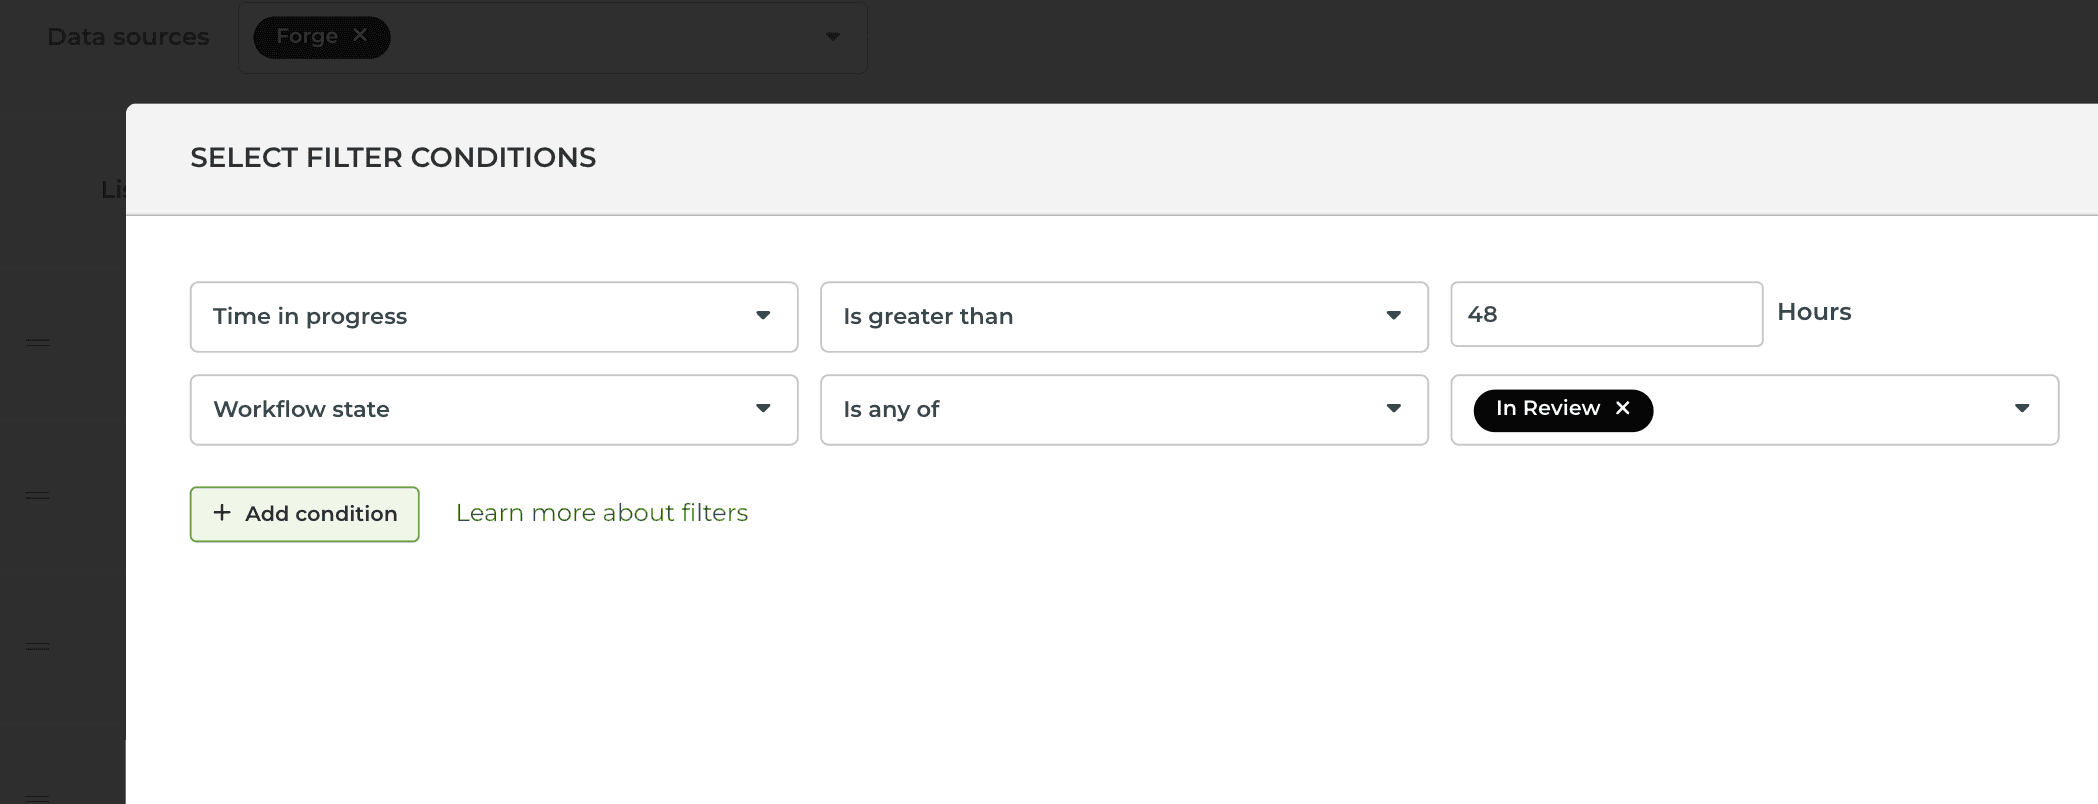
Setting a filter to both Time in progress and Workflow state includes all items that have spent more than 48 hours in the In review state.
You can also filter by time logged to time tracking fields:
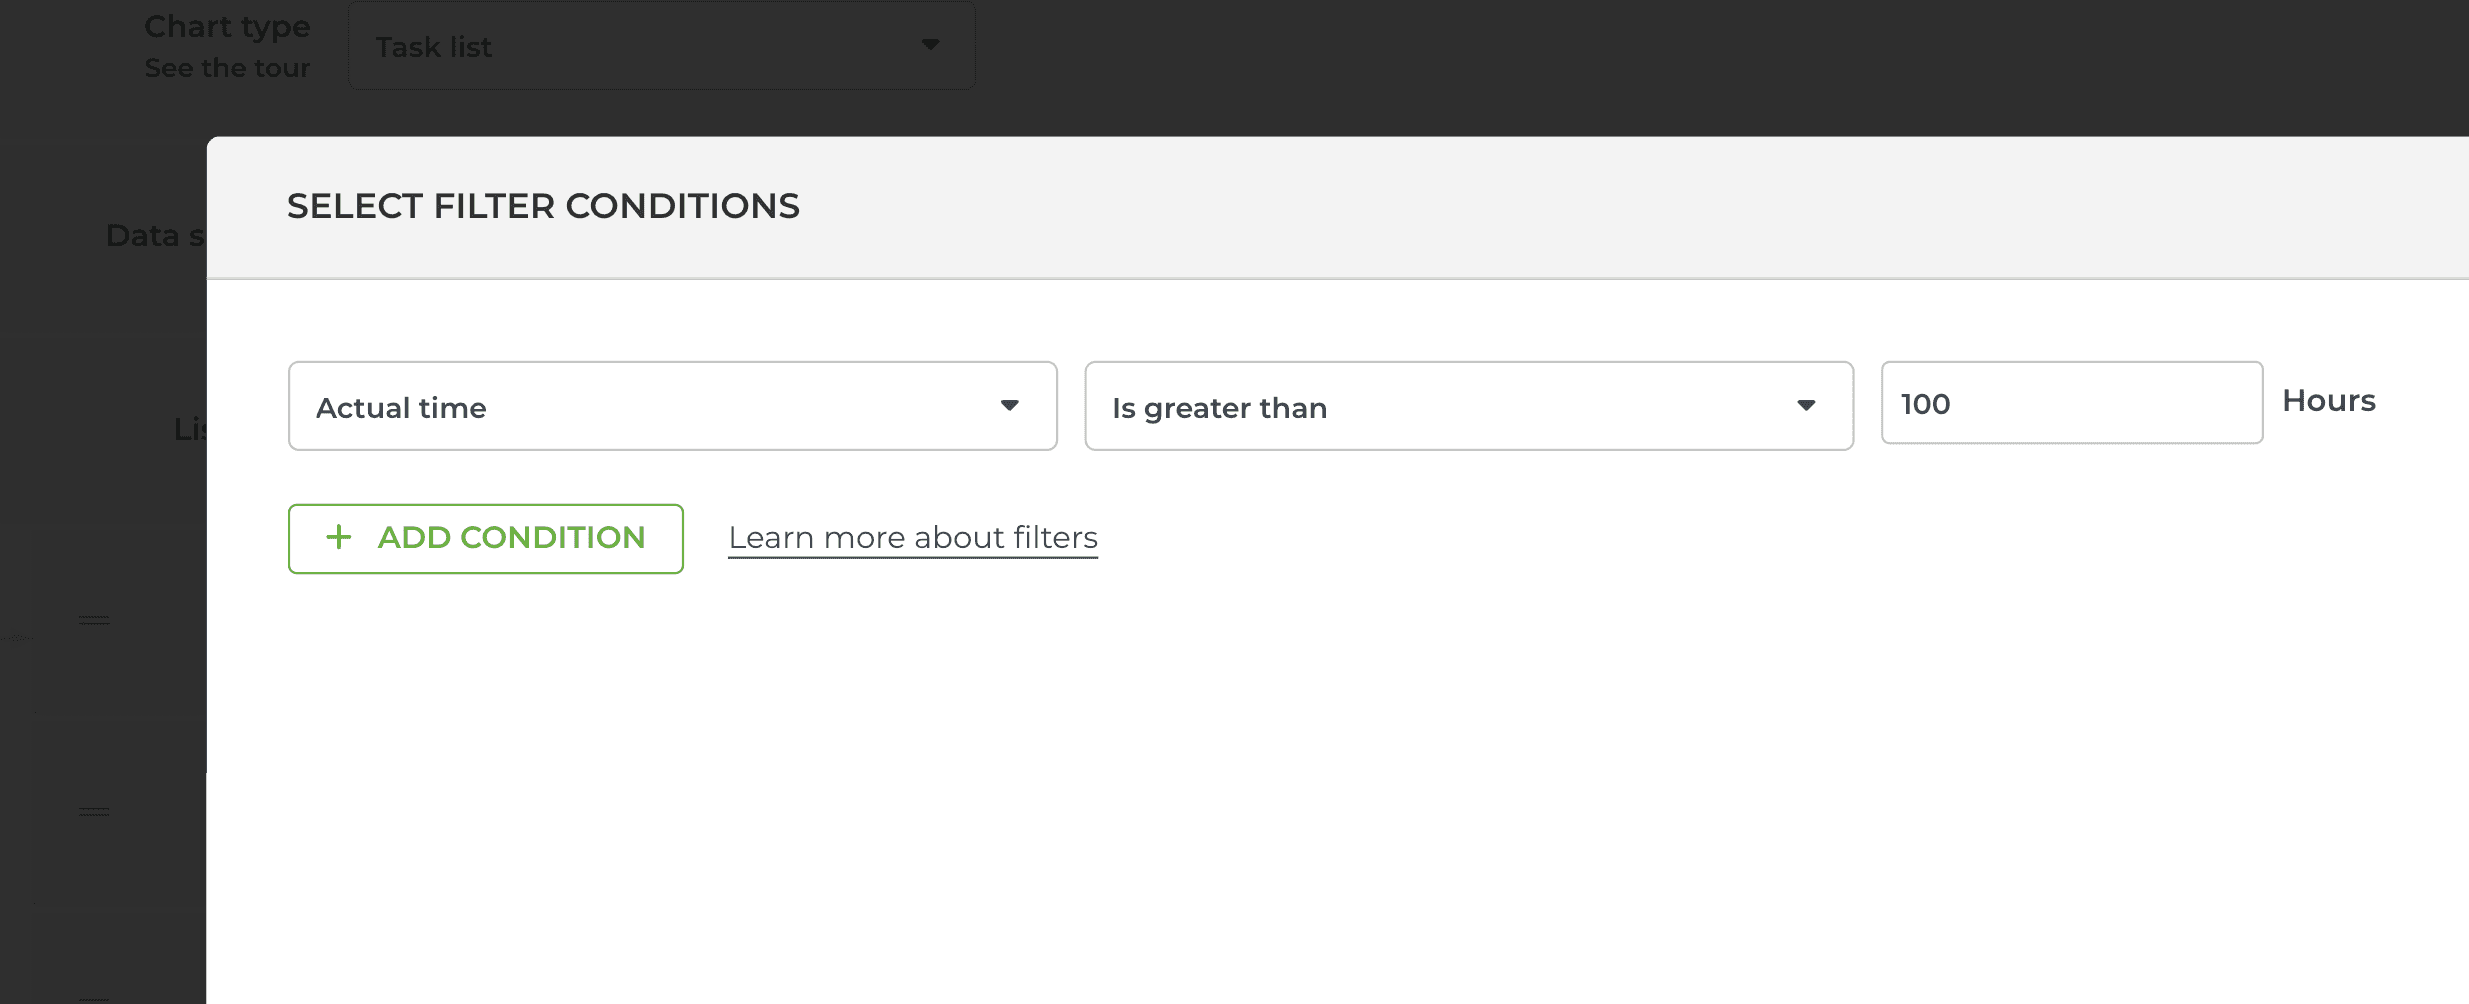
That would include all items with more than 100 hours logged.
Applying AND/OR logic in filters
The filter logic depends on how you construct the filter conditions. When you select multiple is any of options from a single menu, they follow the OR logic:
“Show me items that match this or that (or both).”
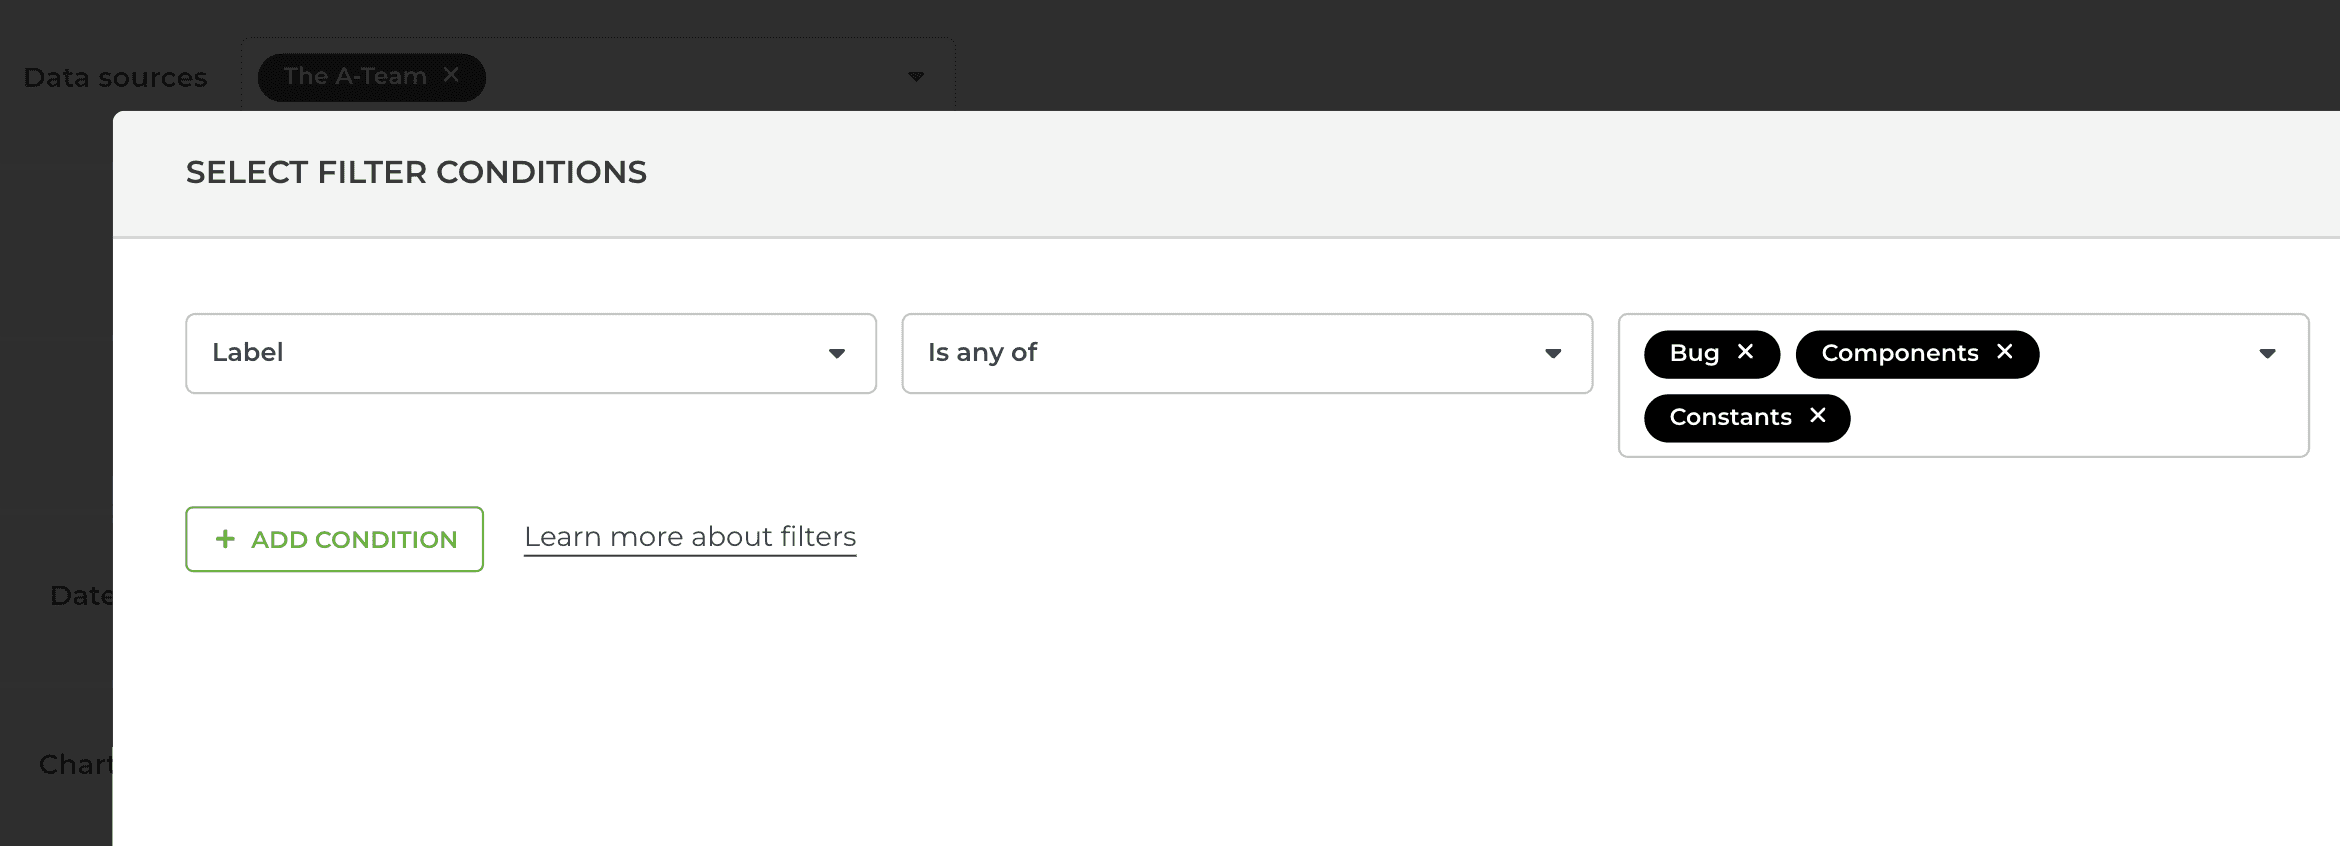
In this case, the filter matches any item that has at least one of the selected options. In terms of logic, they are OR conditions, as it is sufficient if the resulting item contains only one of them.
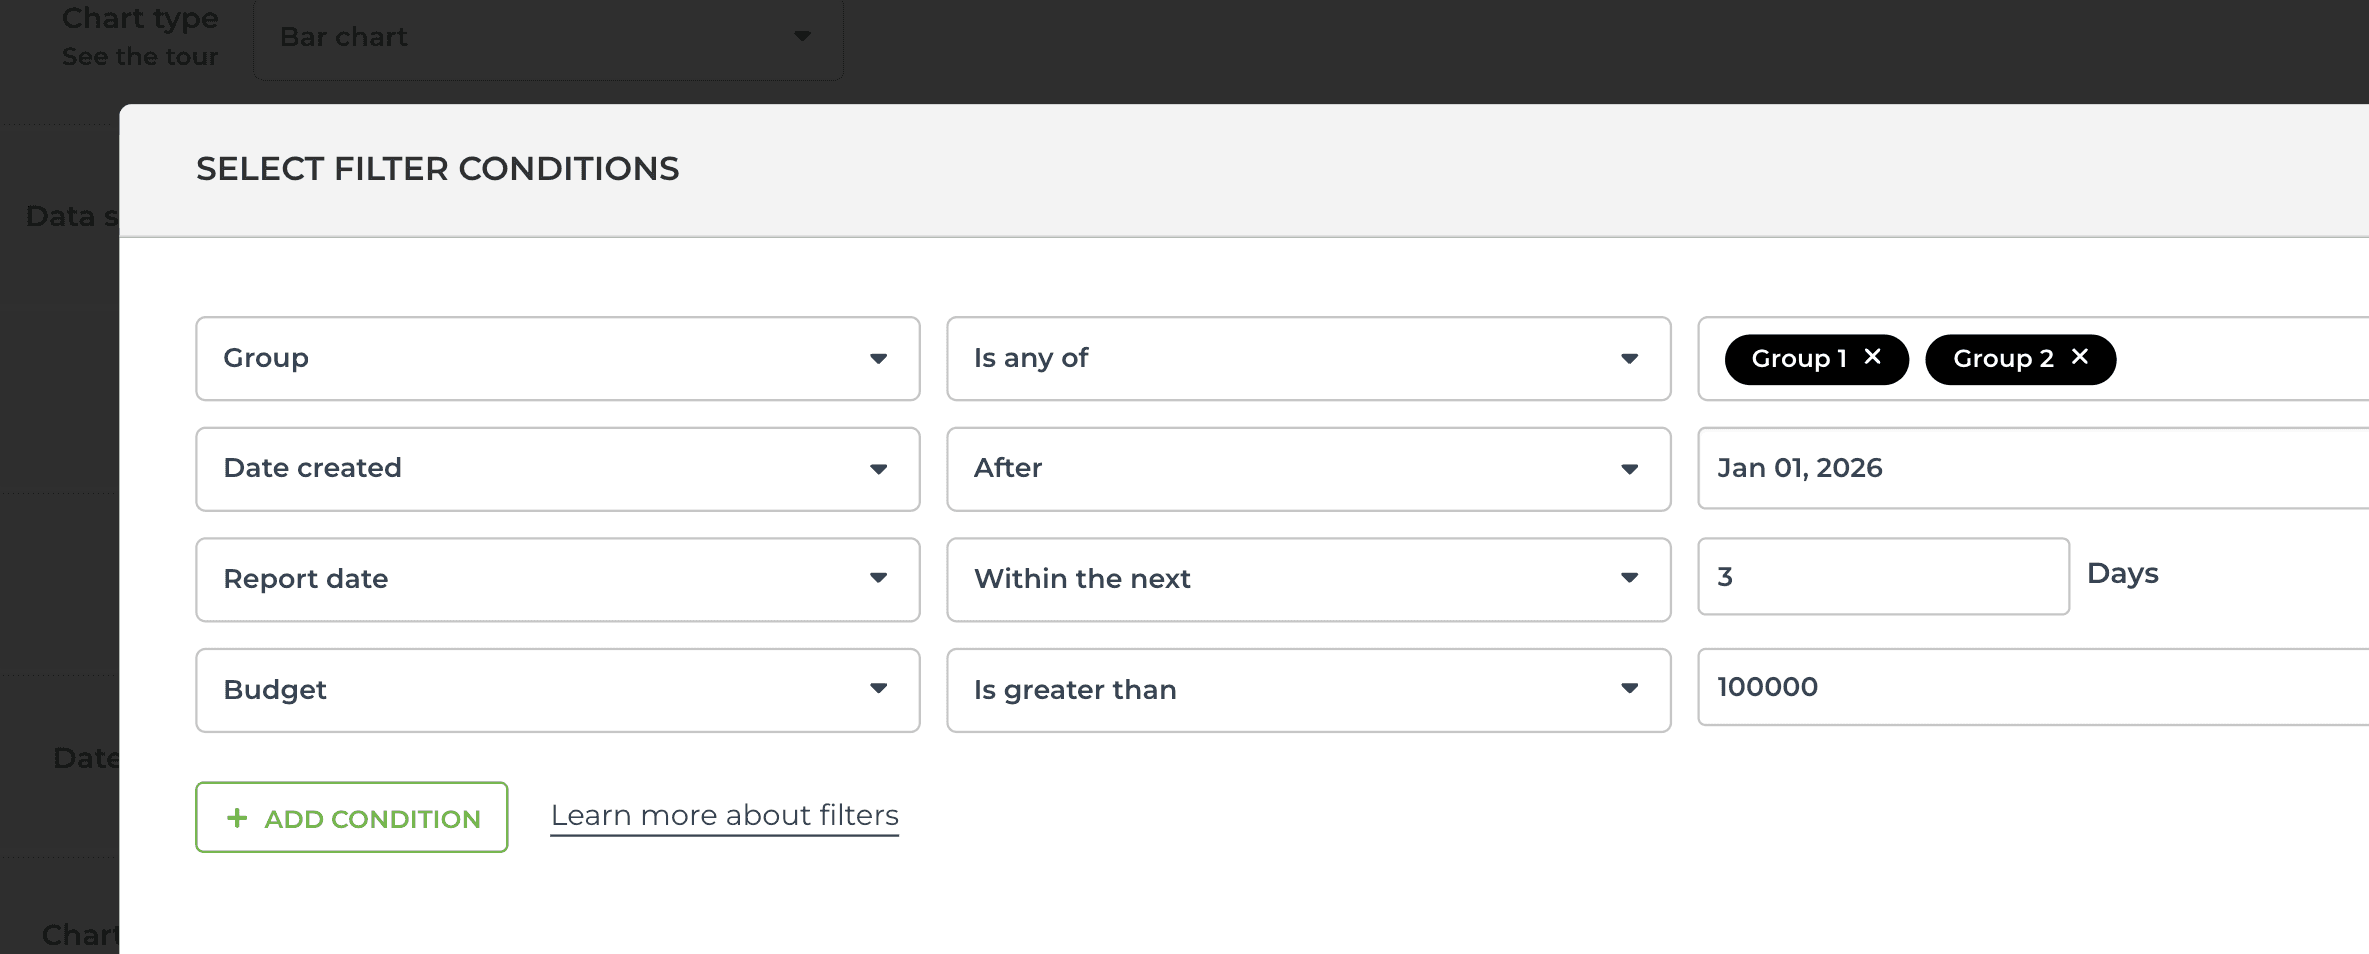
You can also select multiple options by picking them in separate menus. In terms of logic, they are AND conditions since the resulting items must contain all of them.
“Show me items that match this and that.”
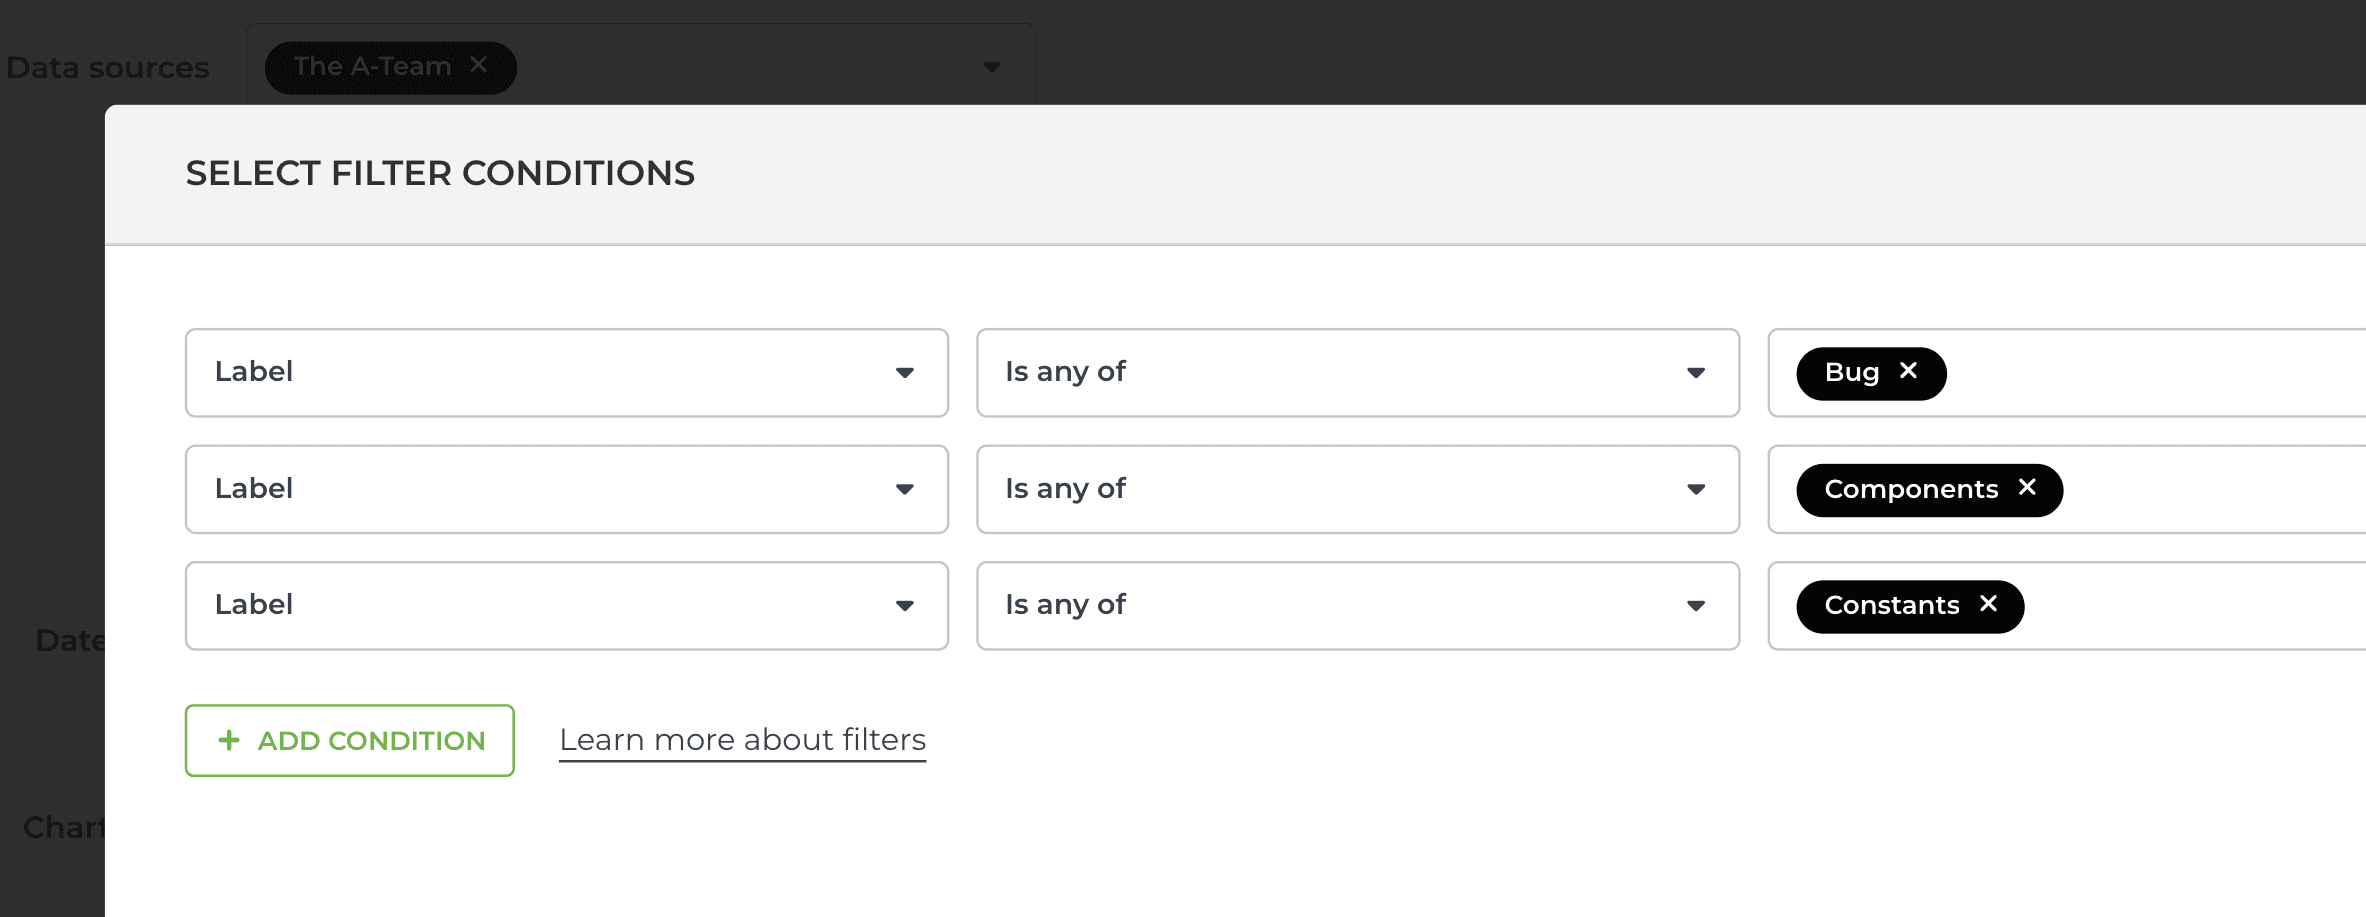
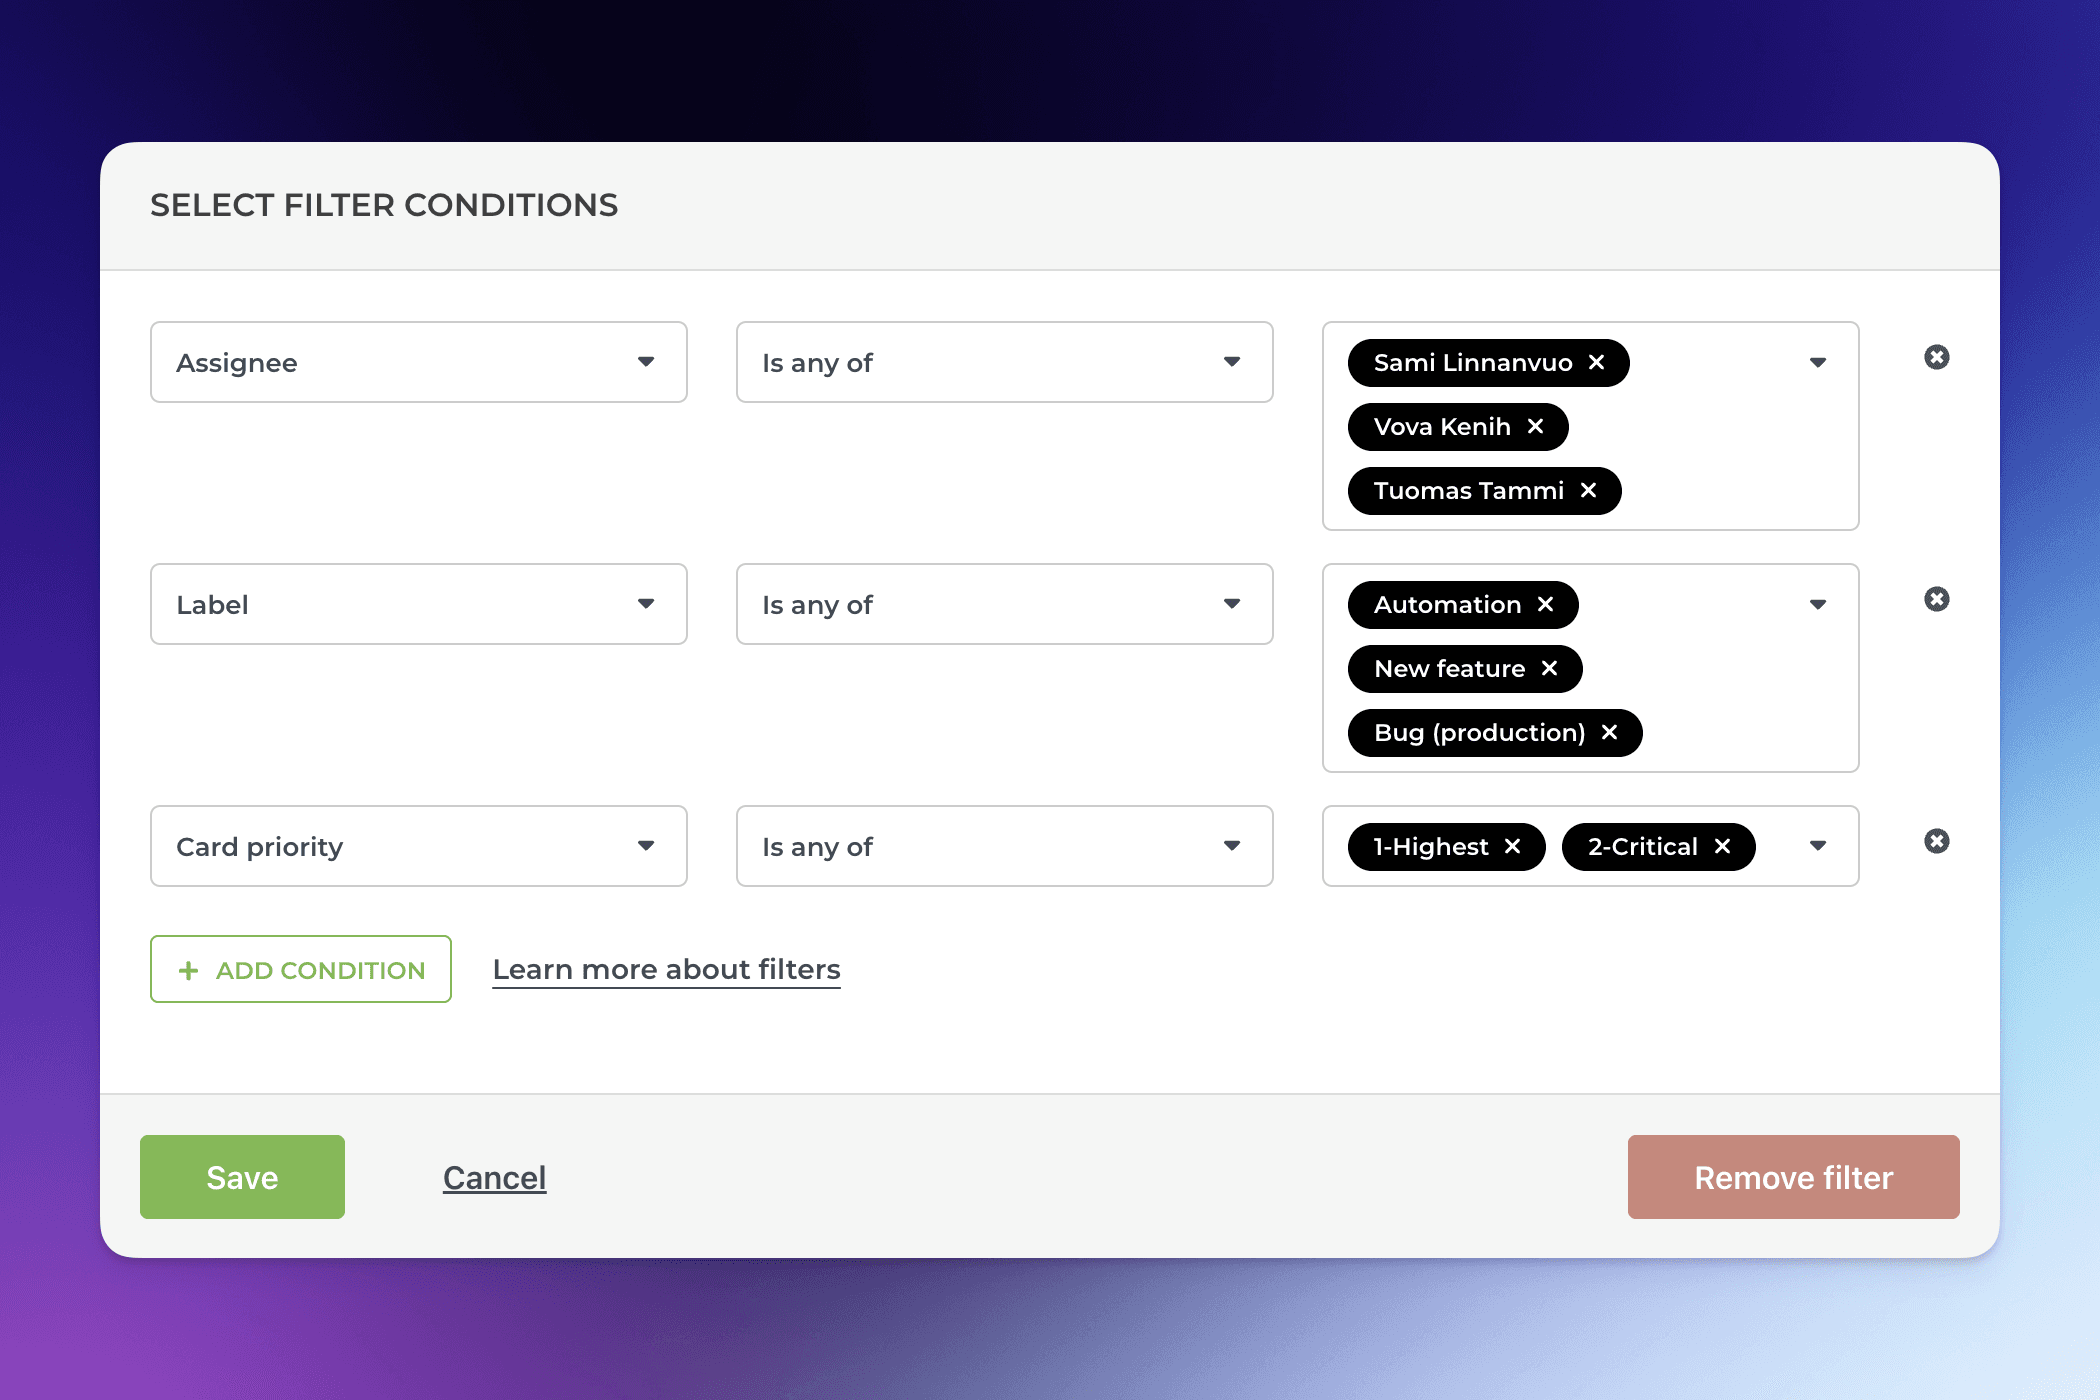
You can combine both in the same filter. Here’s an example of a more complex filter including both AND and OR conditions:
You can add an unlimited number of conditions in one filter, and they can follow either AND/OR logic.
Filtering by overdue, blocked, reopened etc.
To filter a chart by task status, such as blocked, overdue, reopened, completed on time, or completed overdue, select Status from the filter menu and choose the items to include from the following dropdown:
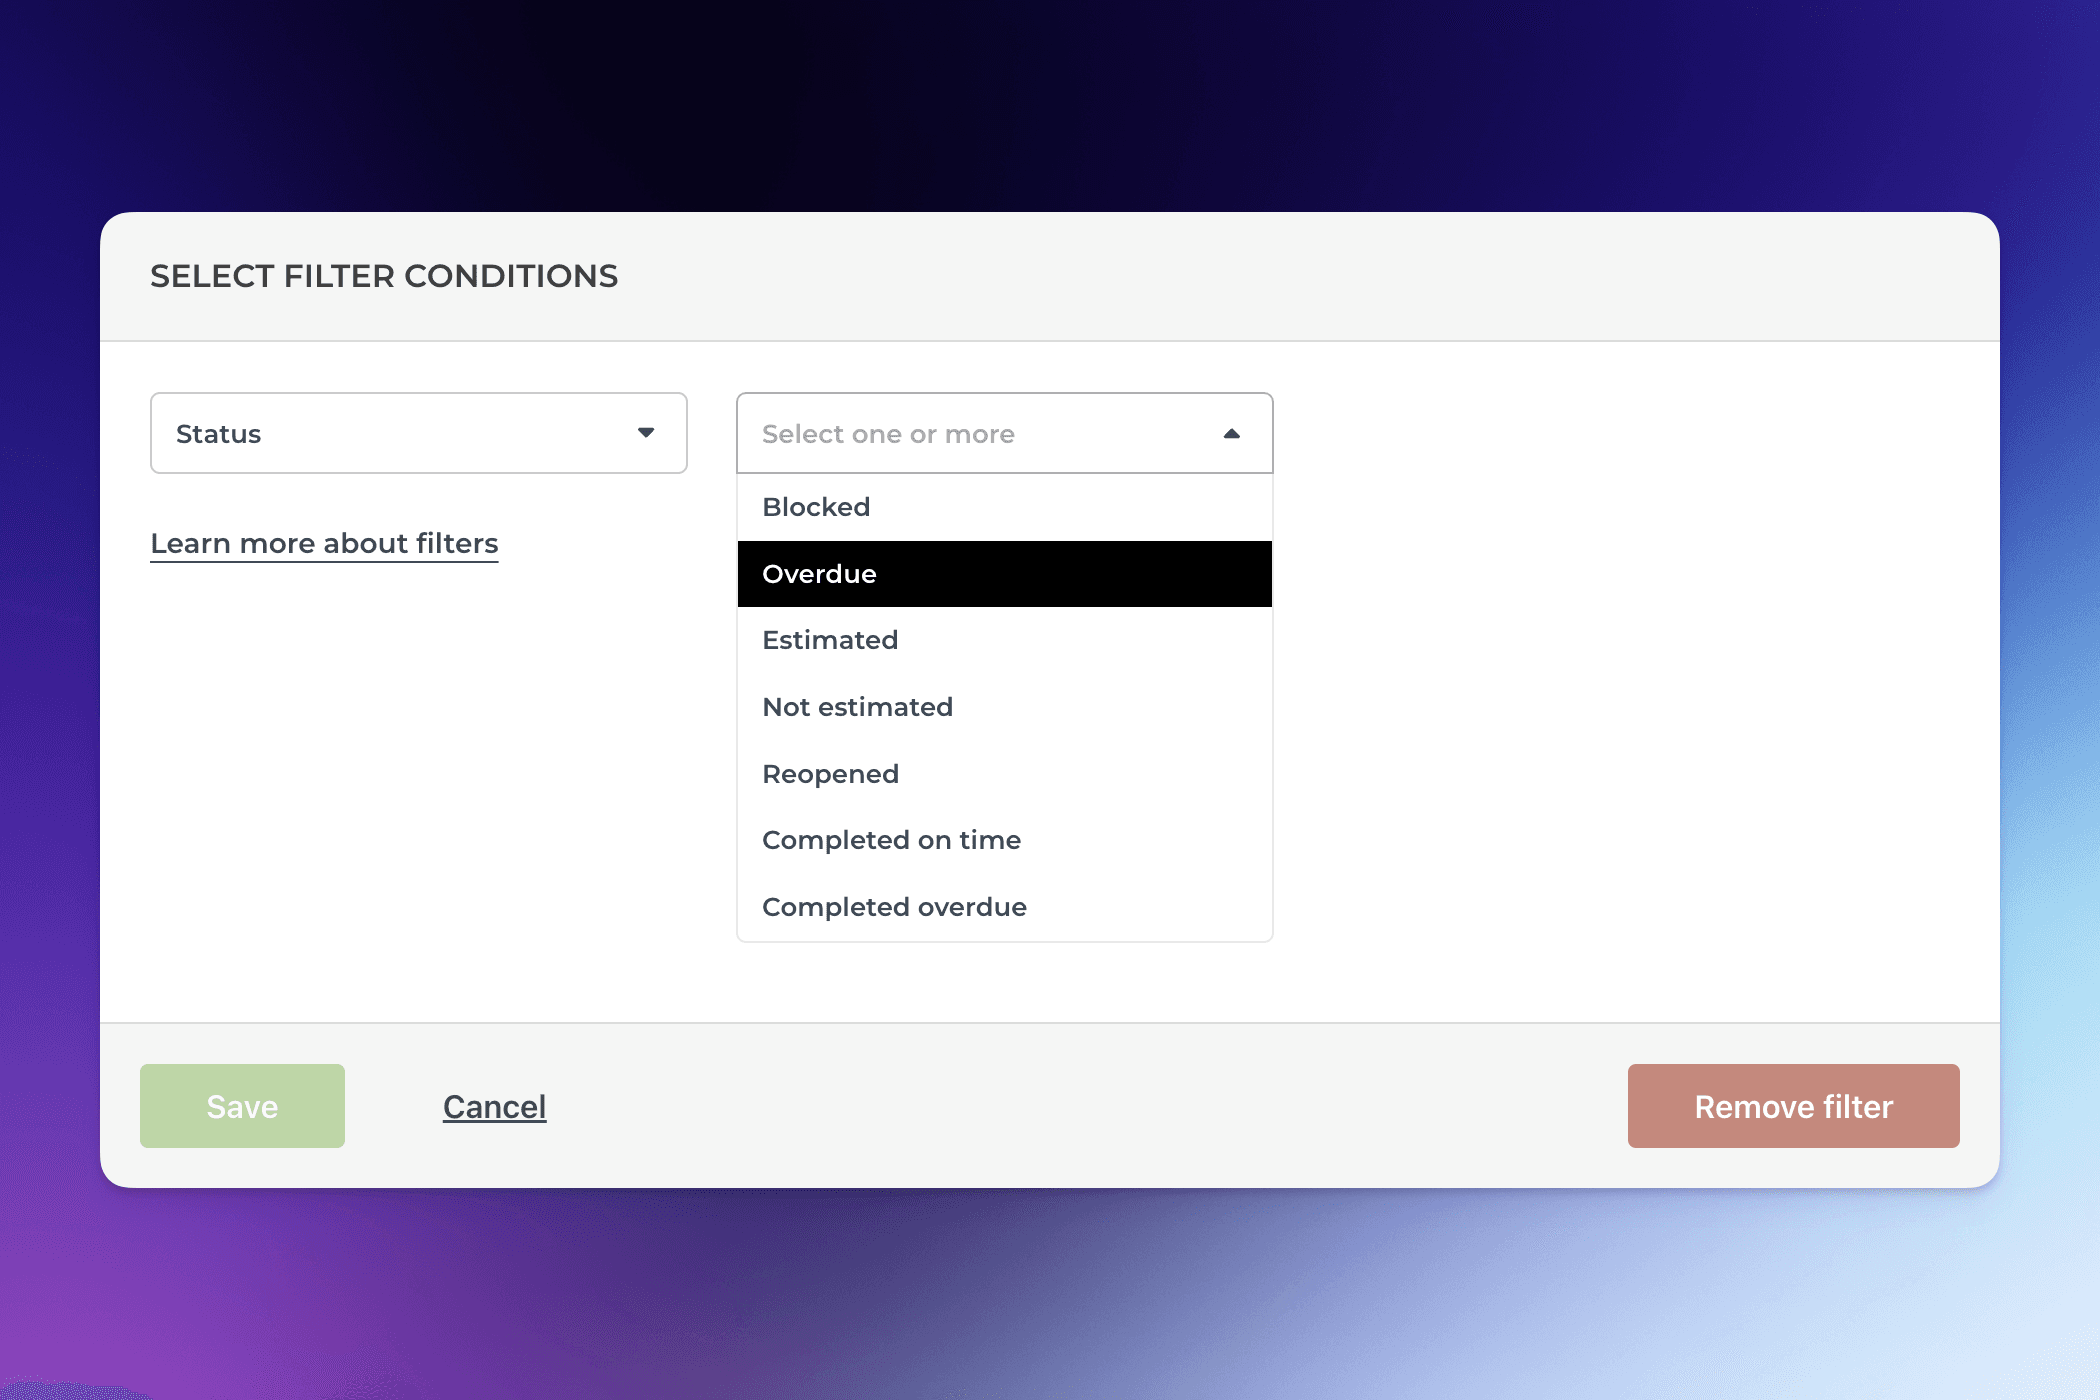
The resulting chart contains the items that meet that criteria.
Configuring a quick filter
In the chart settings, you can configure a quick filter that will be shown on top of the chart. It allows adjusting the chart's content without accessing the chart editor.
In the chart settings, use the toggle to enable the quick filter:
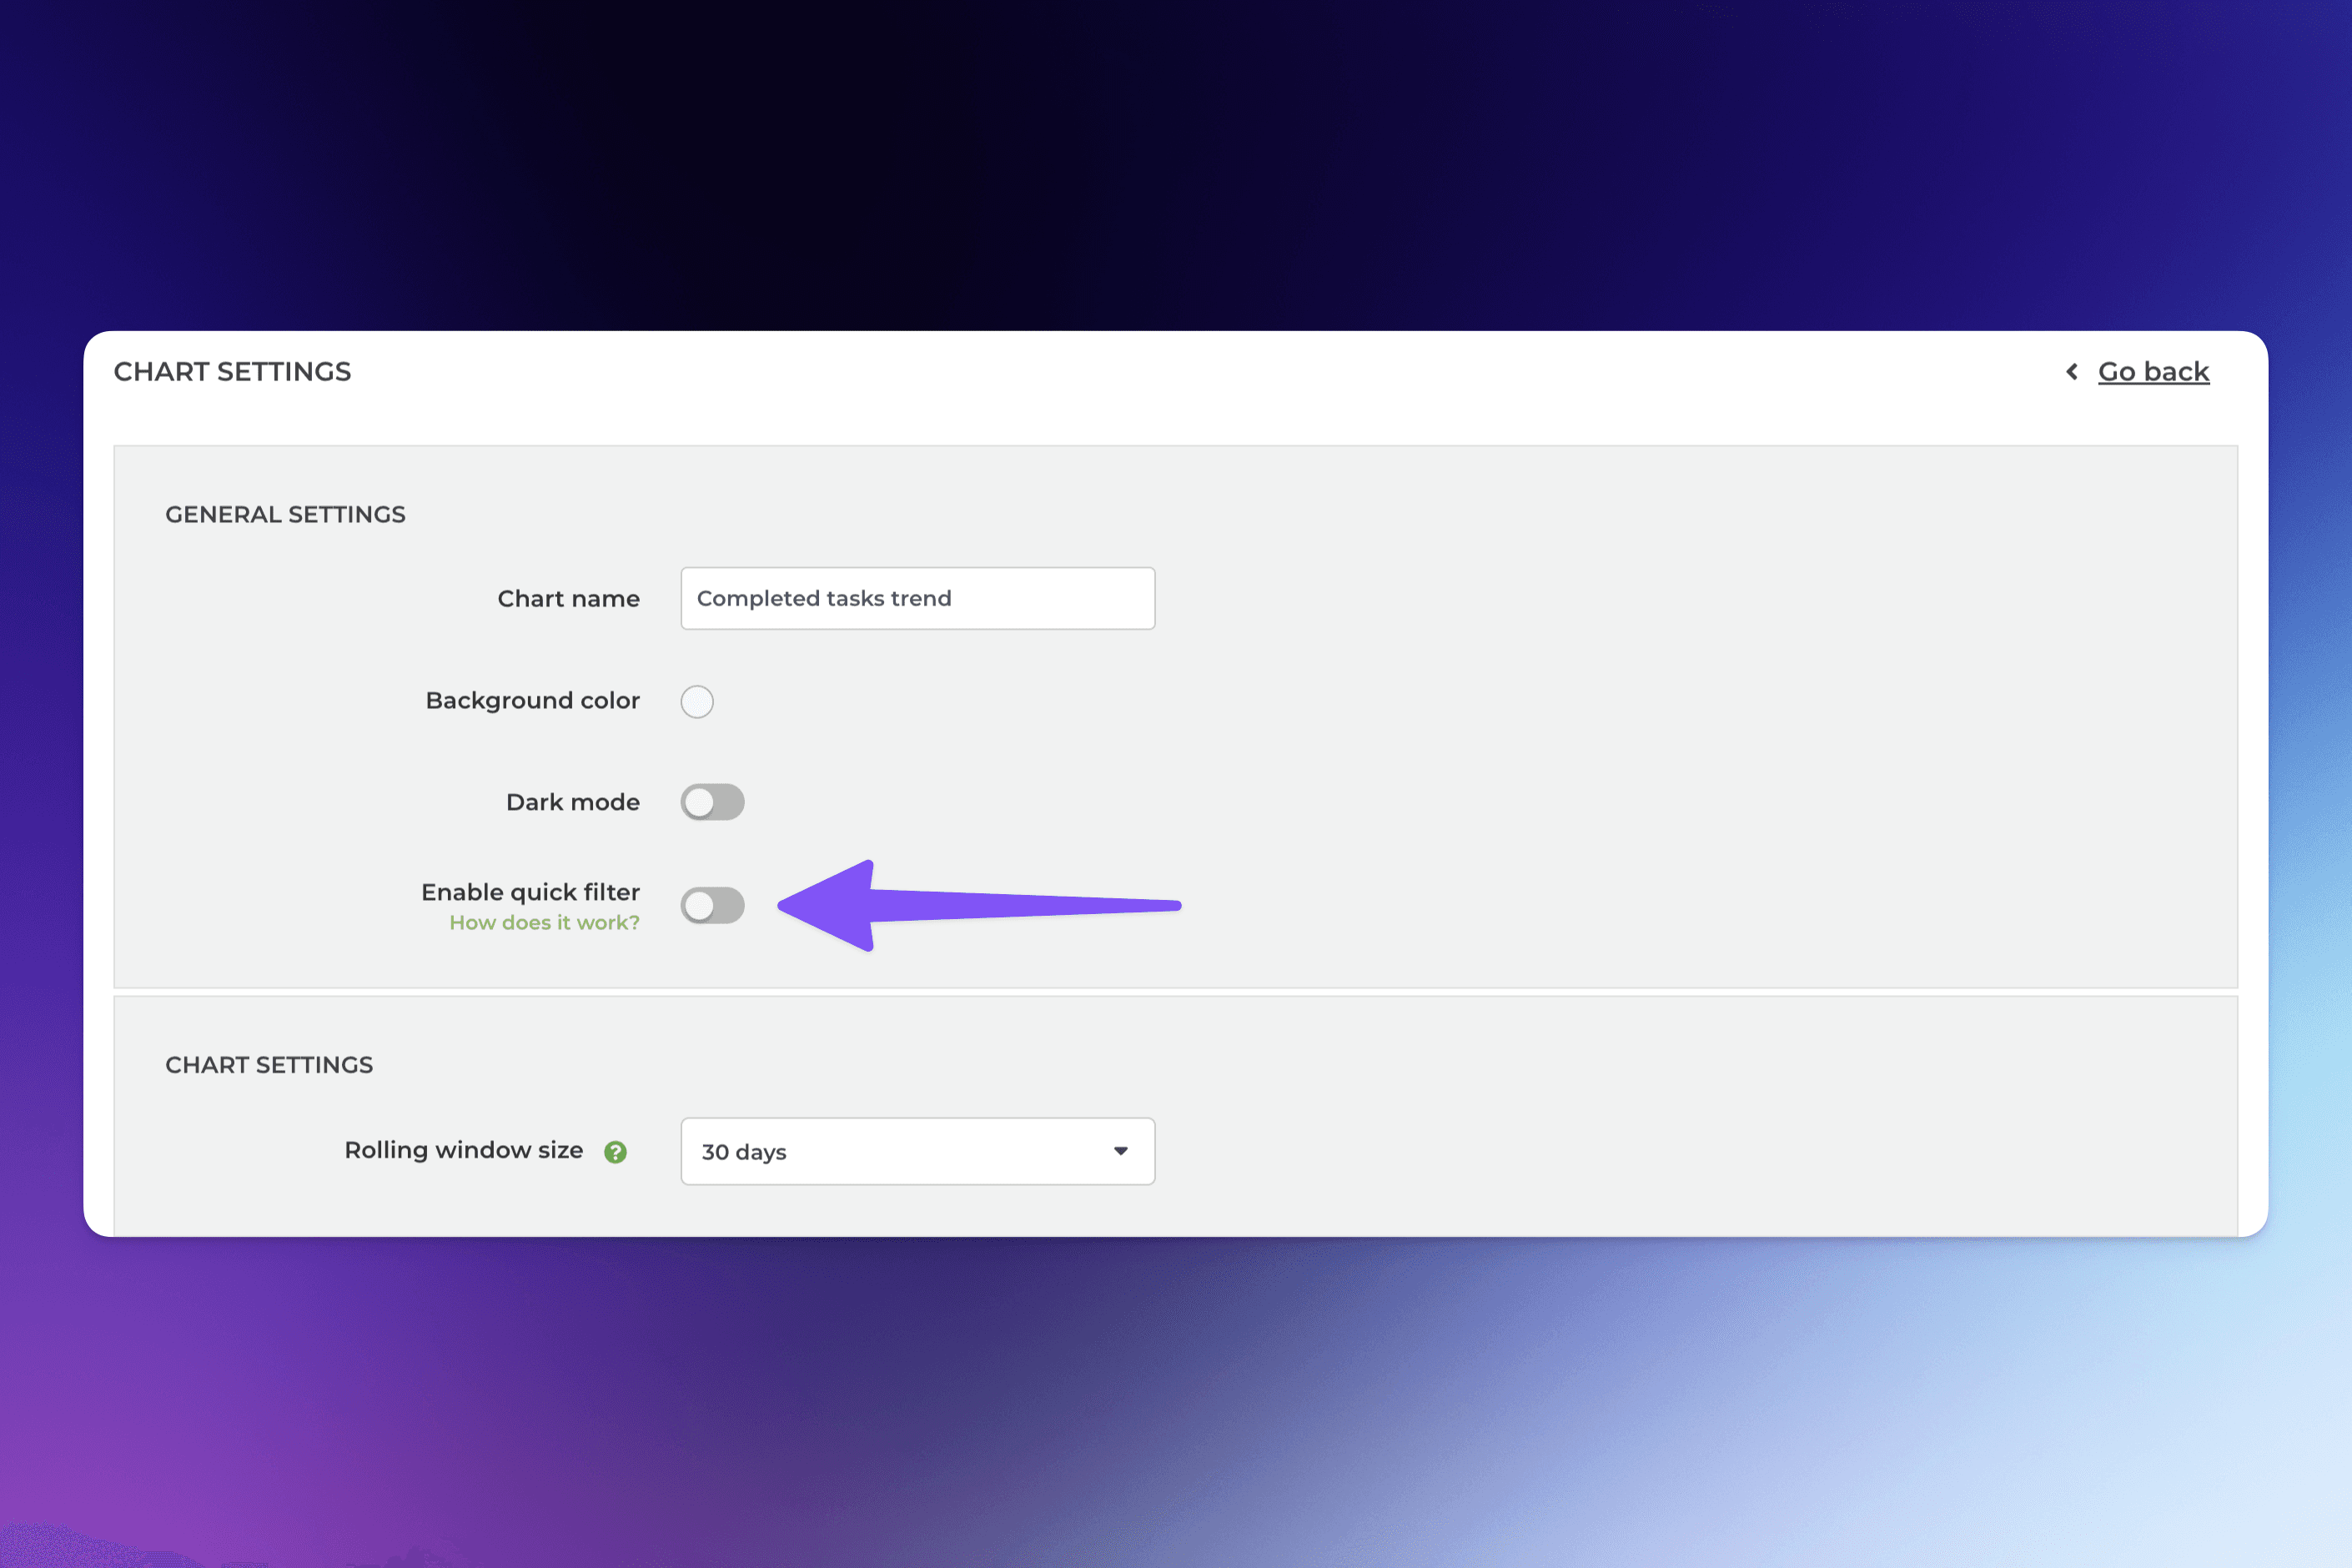
Clicking the toggle reveals the filter options. These are the same options as what you have when setting a filter in the chart editor.
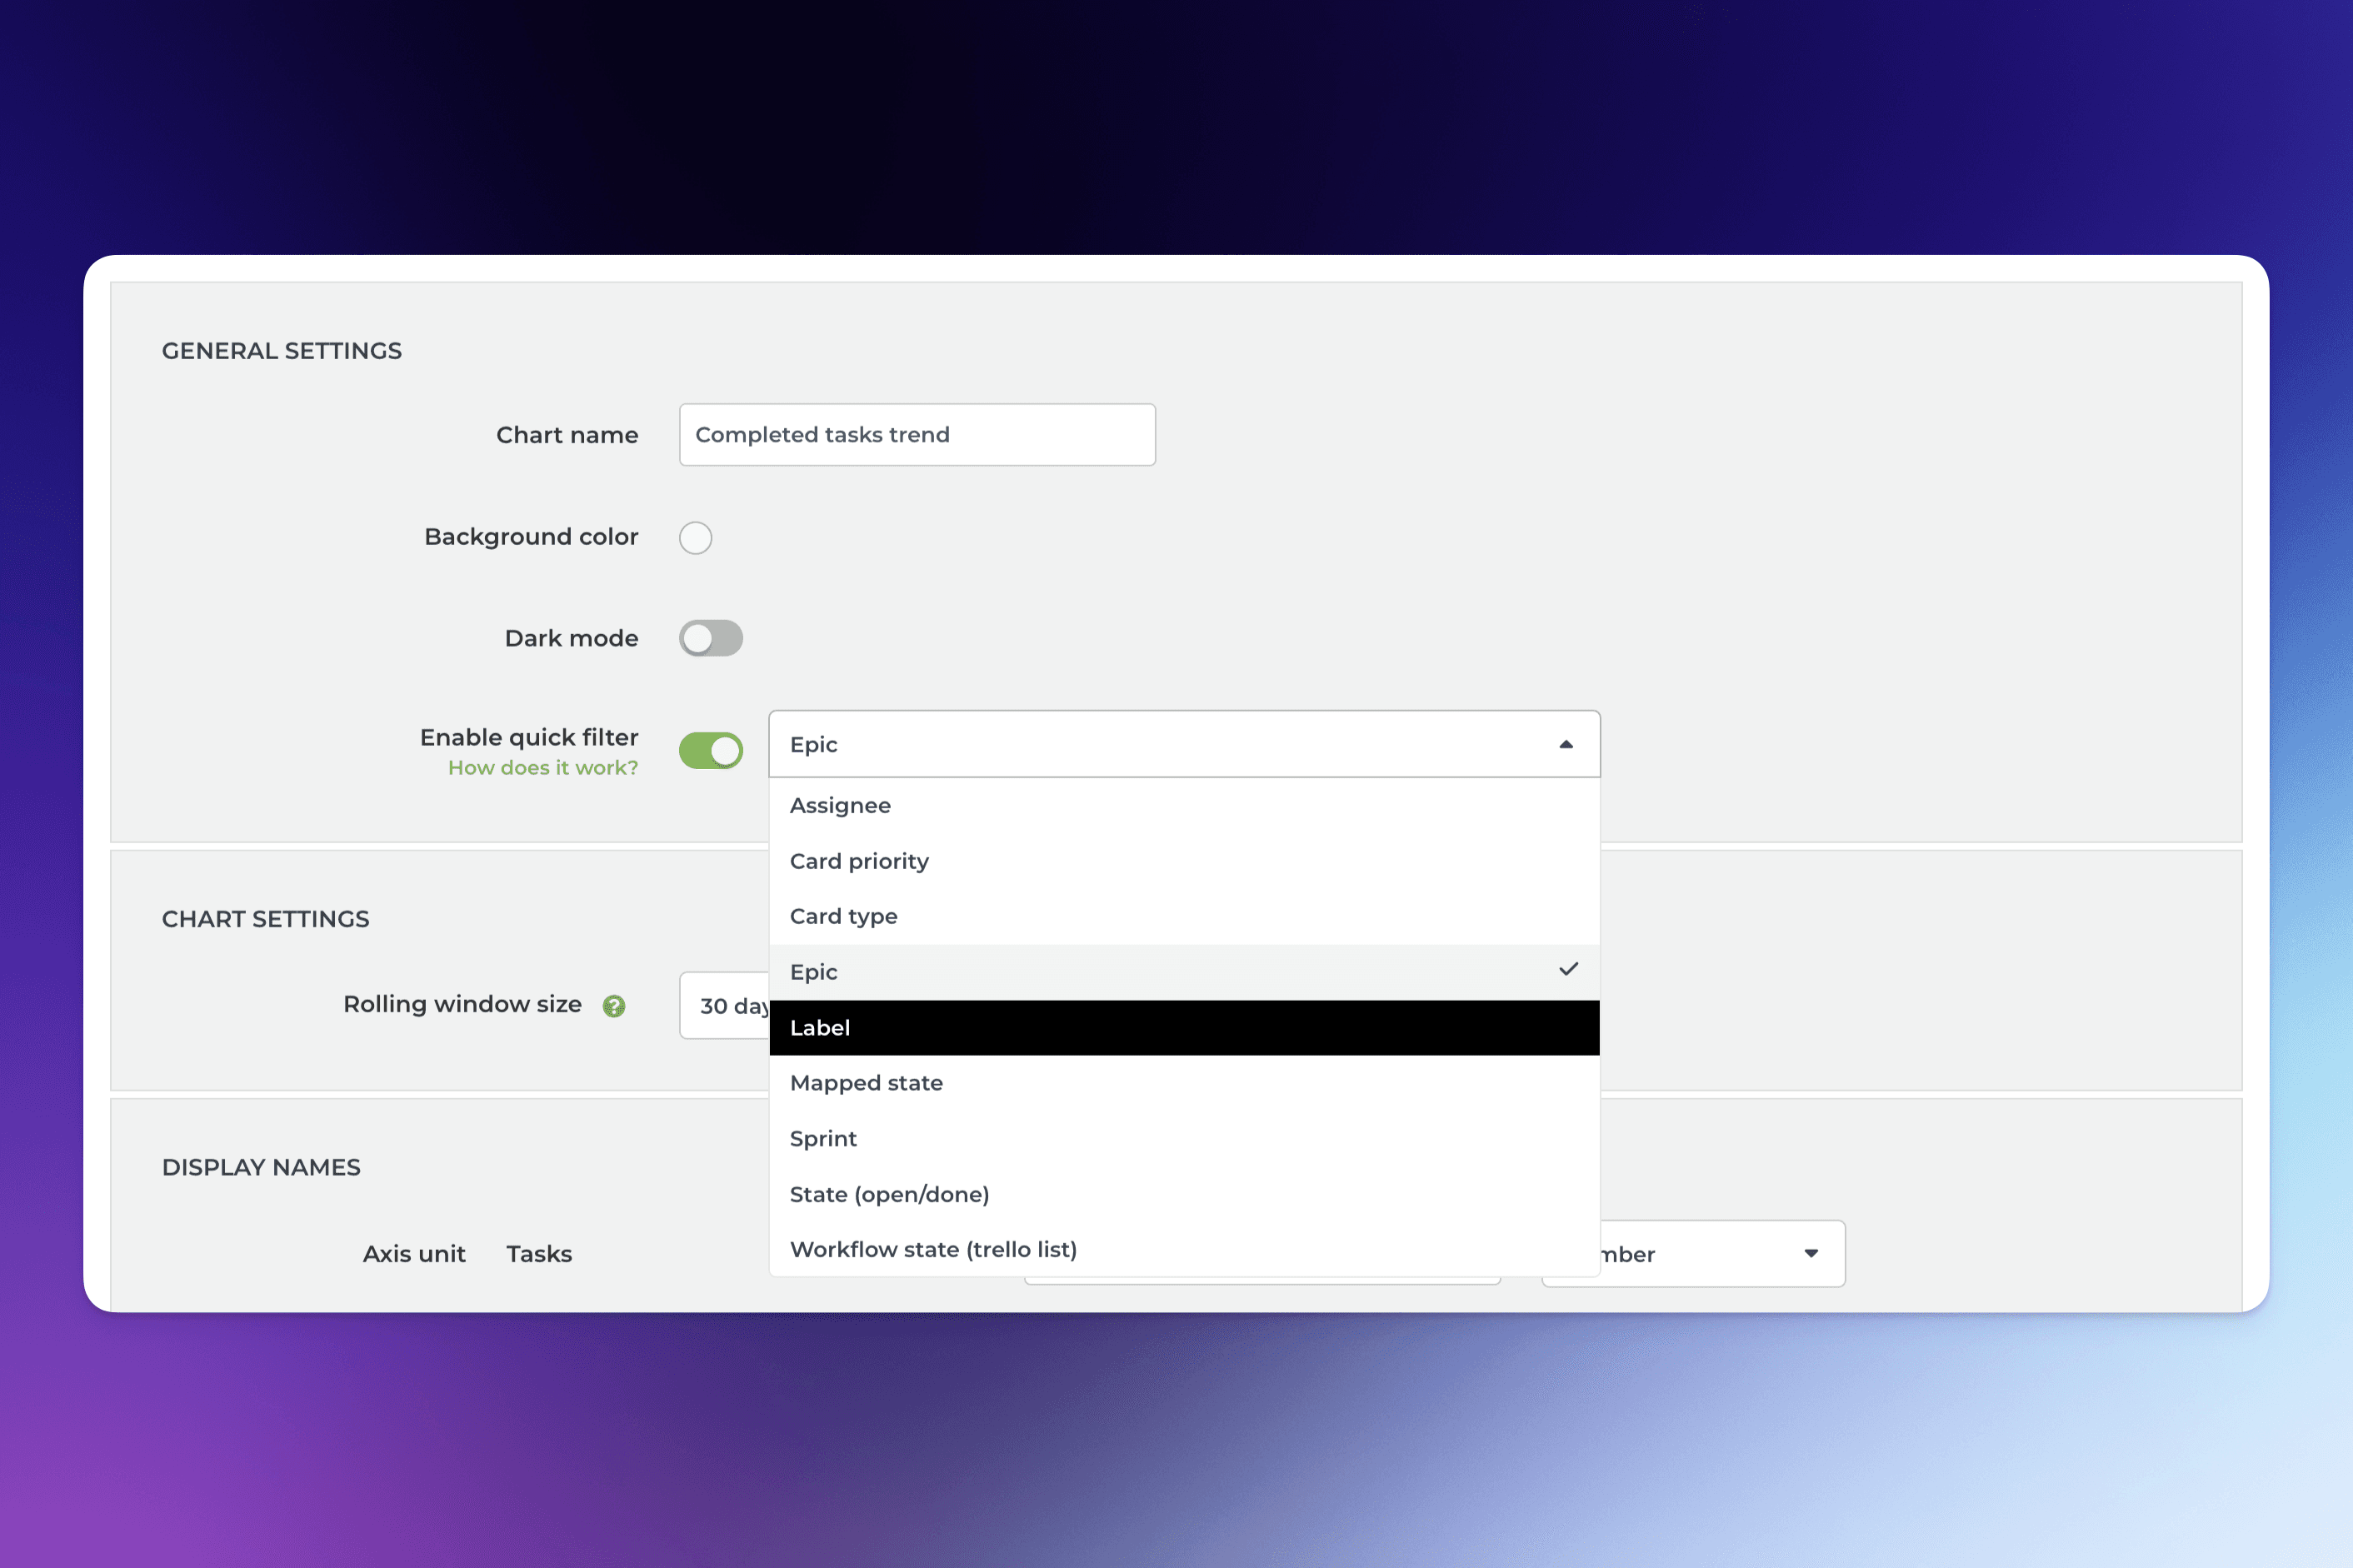
For example, selecting Label from the menu creates a quick filter for the label shown above the chart. The default selection is All labels, and you can filter the content by any available label by picking a label from the menu:
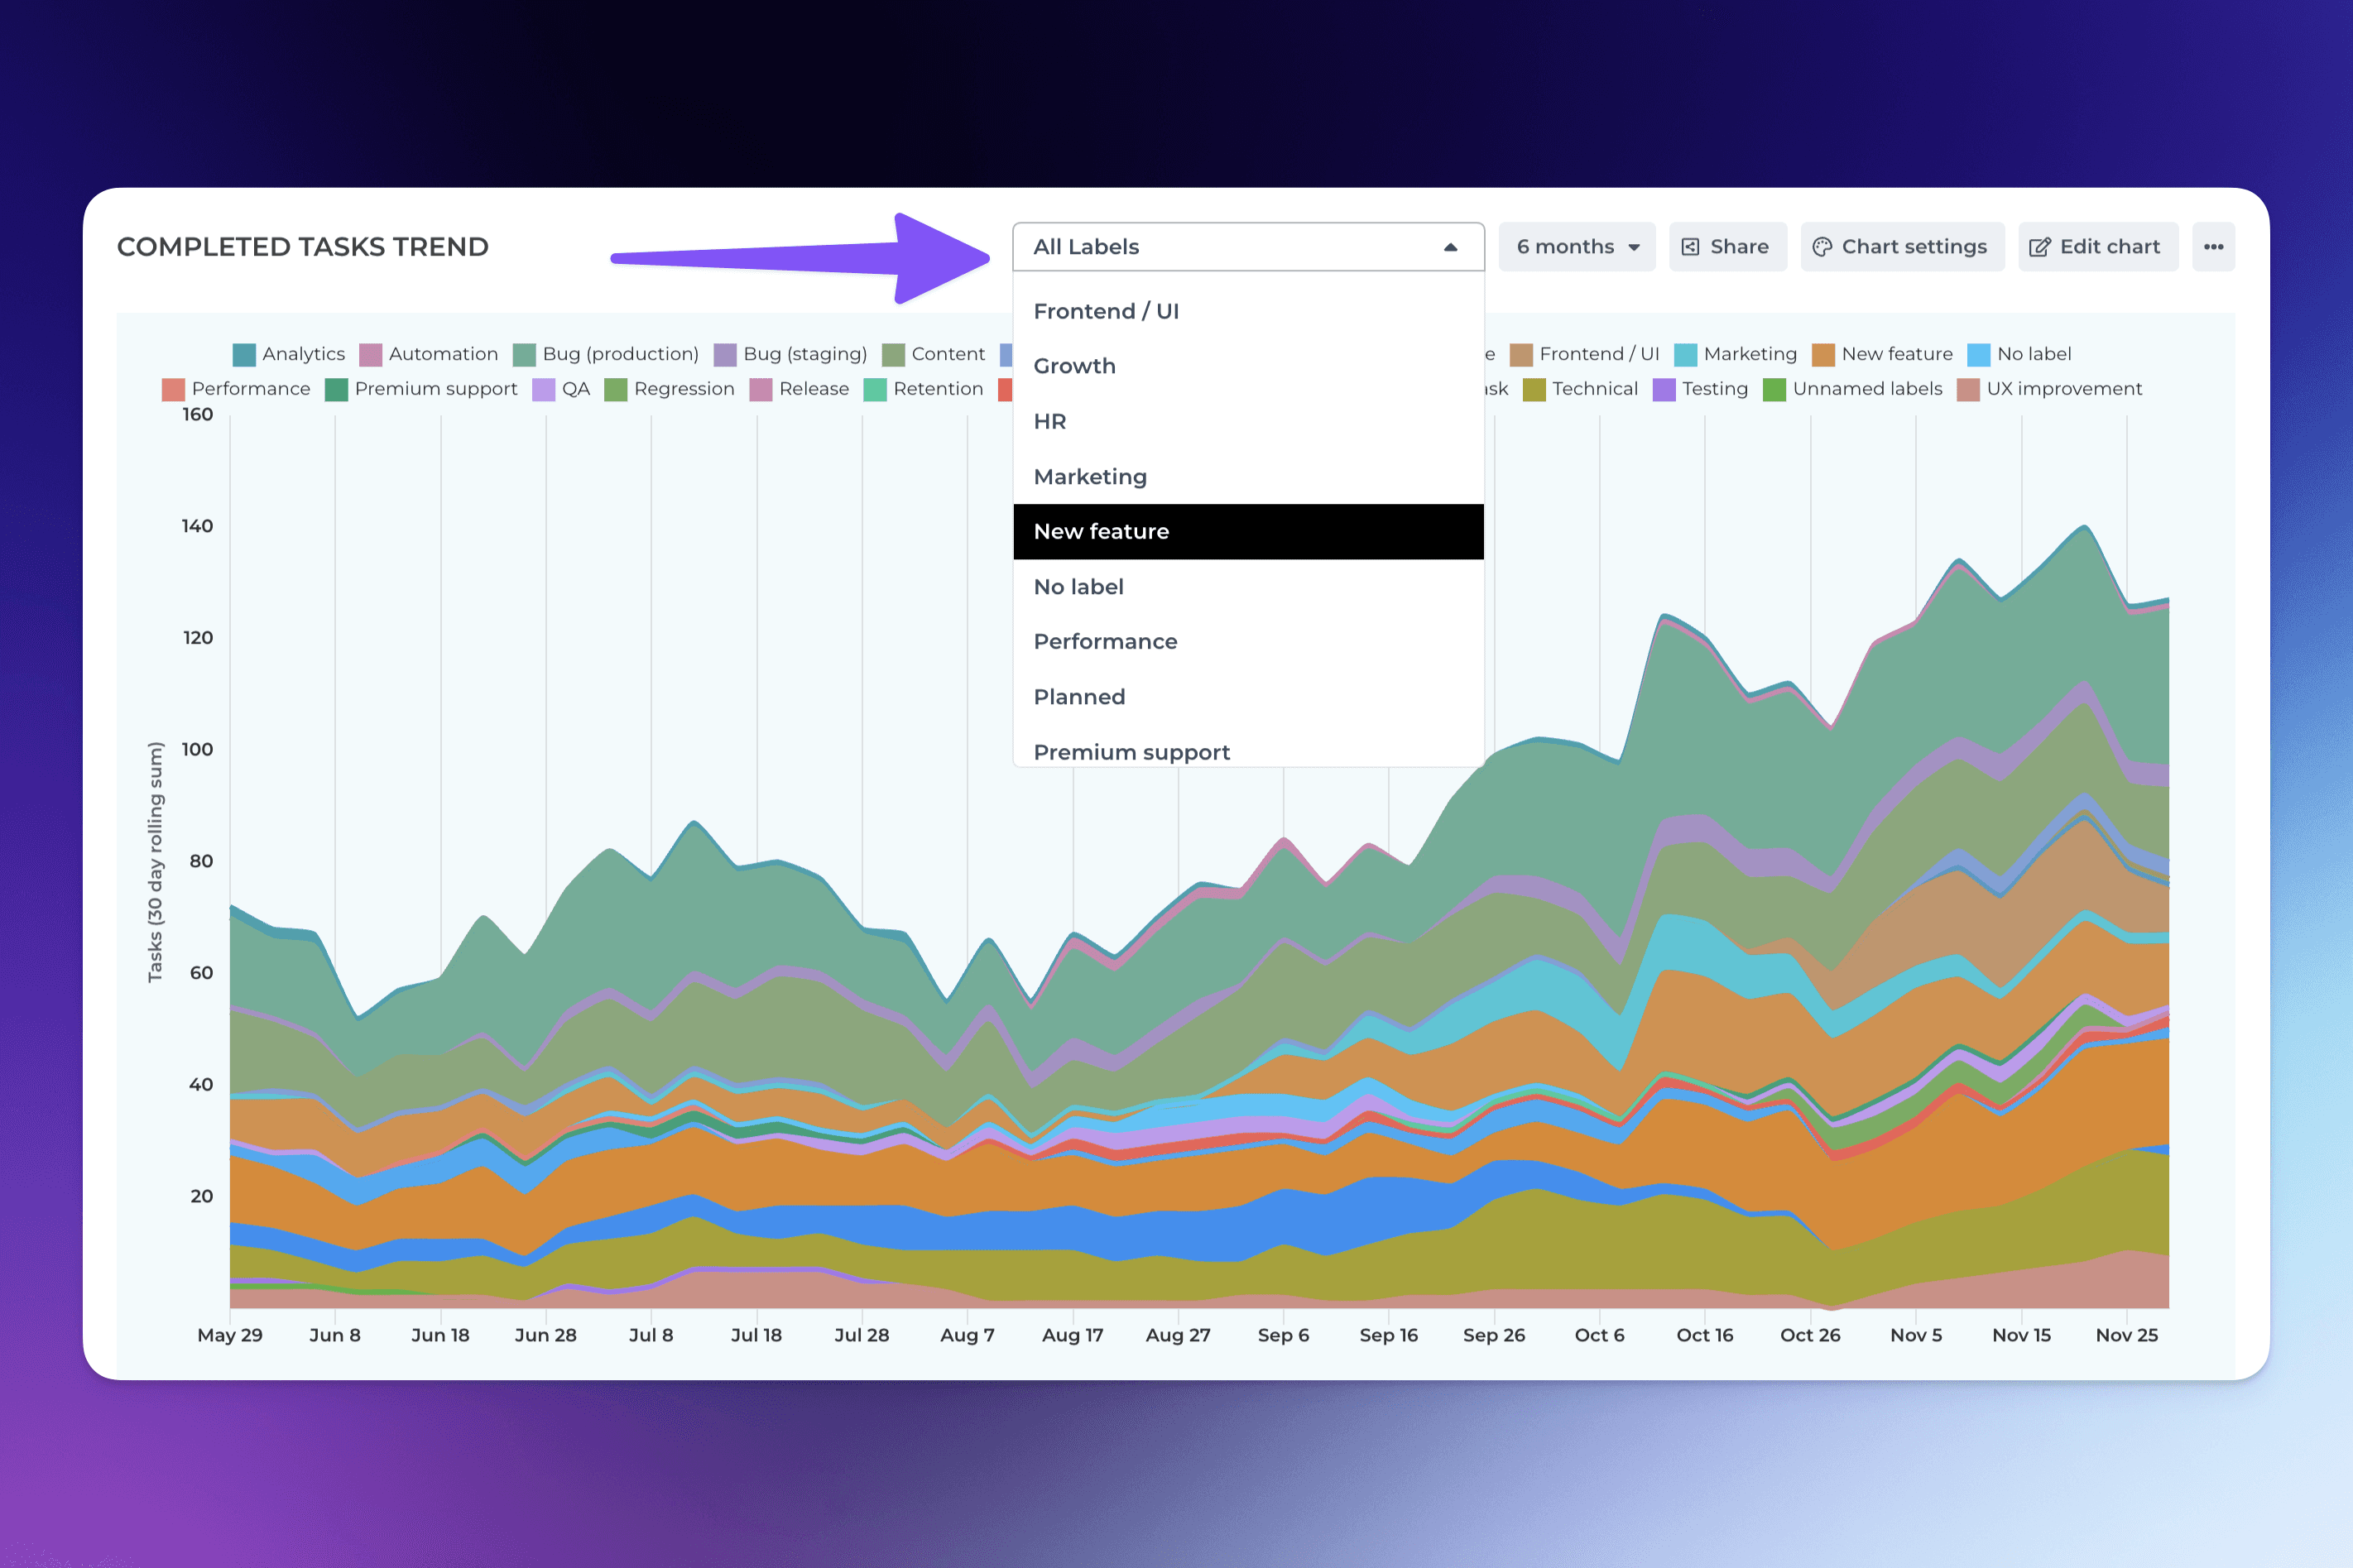
When you select filter criteria from the menu, the chart content is filtered by that selection. It allows quick comparisons between labels, iterations, departments, customers, or any other property you have in your data!
You can limit the number of options in a quick filter by setting the same filter inside the chart editor. The quick filter will contain only the items that are explicitly included in the filter
When you enable a quick filter for a chart, it will be present when the chart is shared with a link, embedded in a website, or added to a report.