You can track the metrics of monday.com subitems as you would track the metrics of your top-level items. Charts can be set to display information about your subitems, top-level items, or both by setting a filter.
Importing subitems
Here is an example of a board that contains subitems:

To import subitems, proceed to Integrations in Screenful settings and add a new data source.

On the board selection step, make sure to select the Subitems of [board name] from the list of your monday.com boards:

Creating charts with both items and subitems
To track subitems with Screenful charts, add the Subitems of [board name] as a data source. You can track multiple data sources with a single chart. For example, you can add both your board and the subitems of the board as a chart’s data sources:
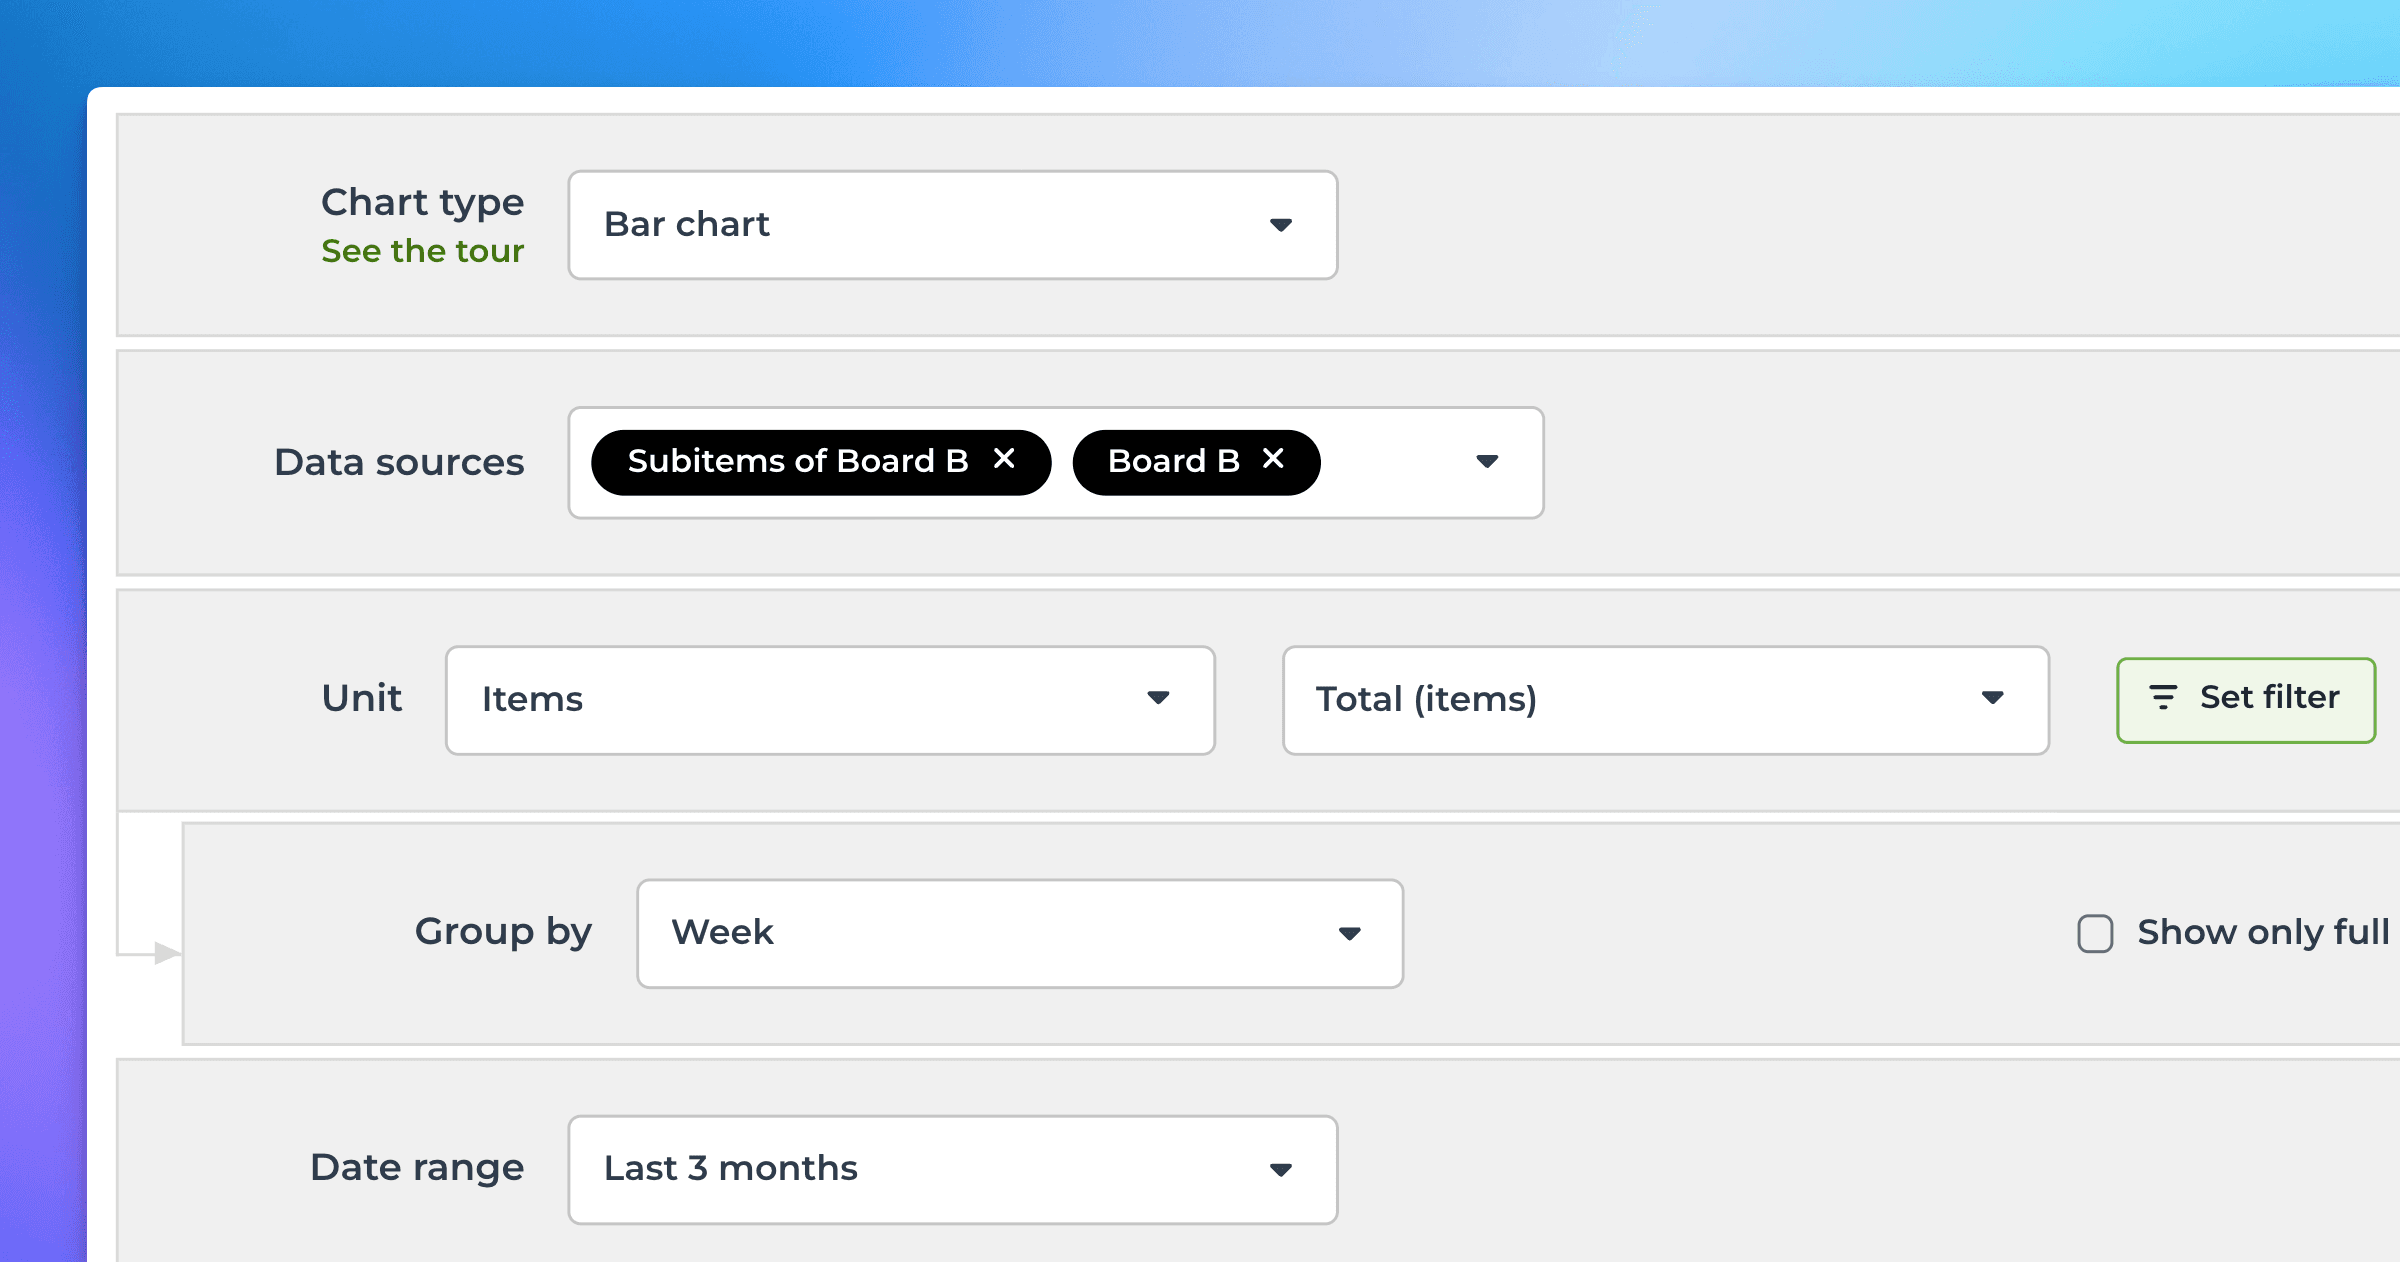
This will allow you to track both your items and subitems in one place.
You can create charts based on your top-level tasks or subtasks. Here’s an example Task List that contains both tasks and subtasks of a monday.com project:
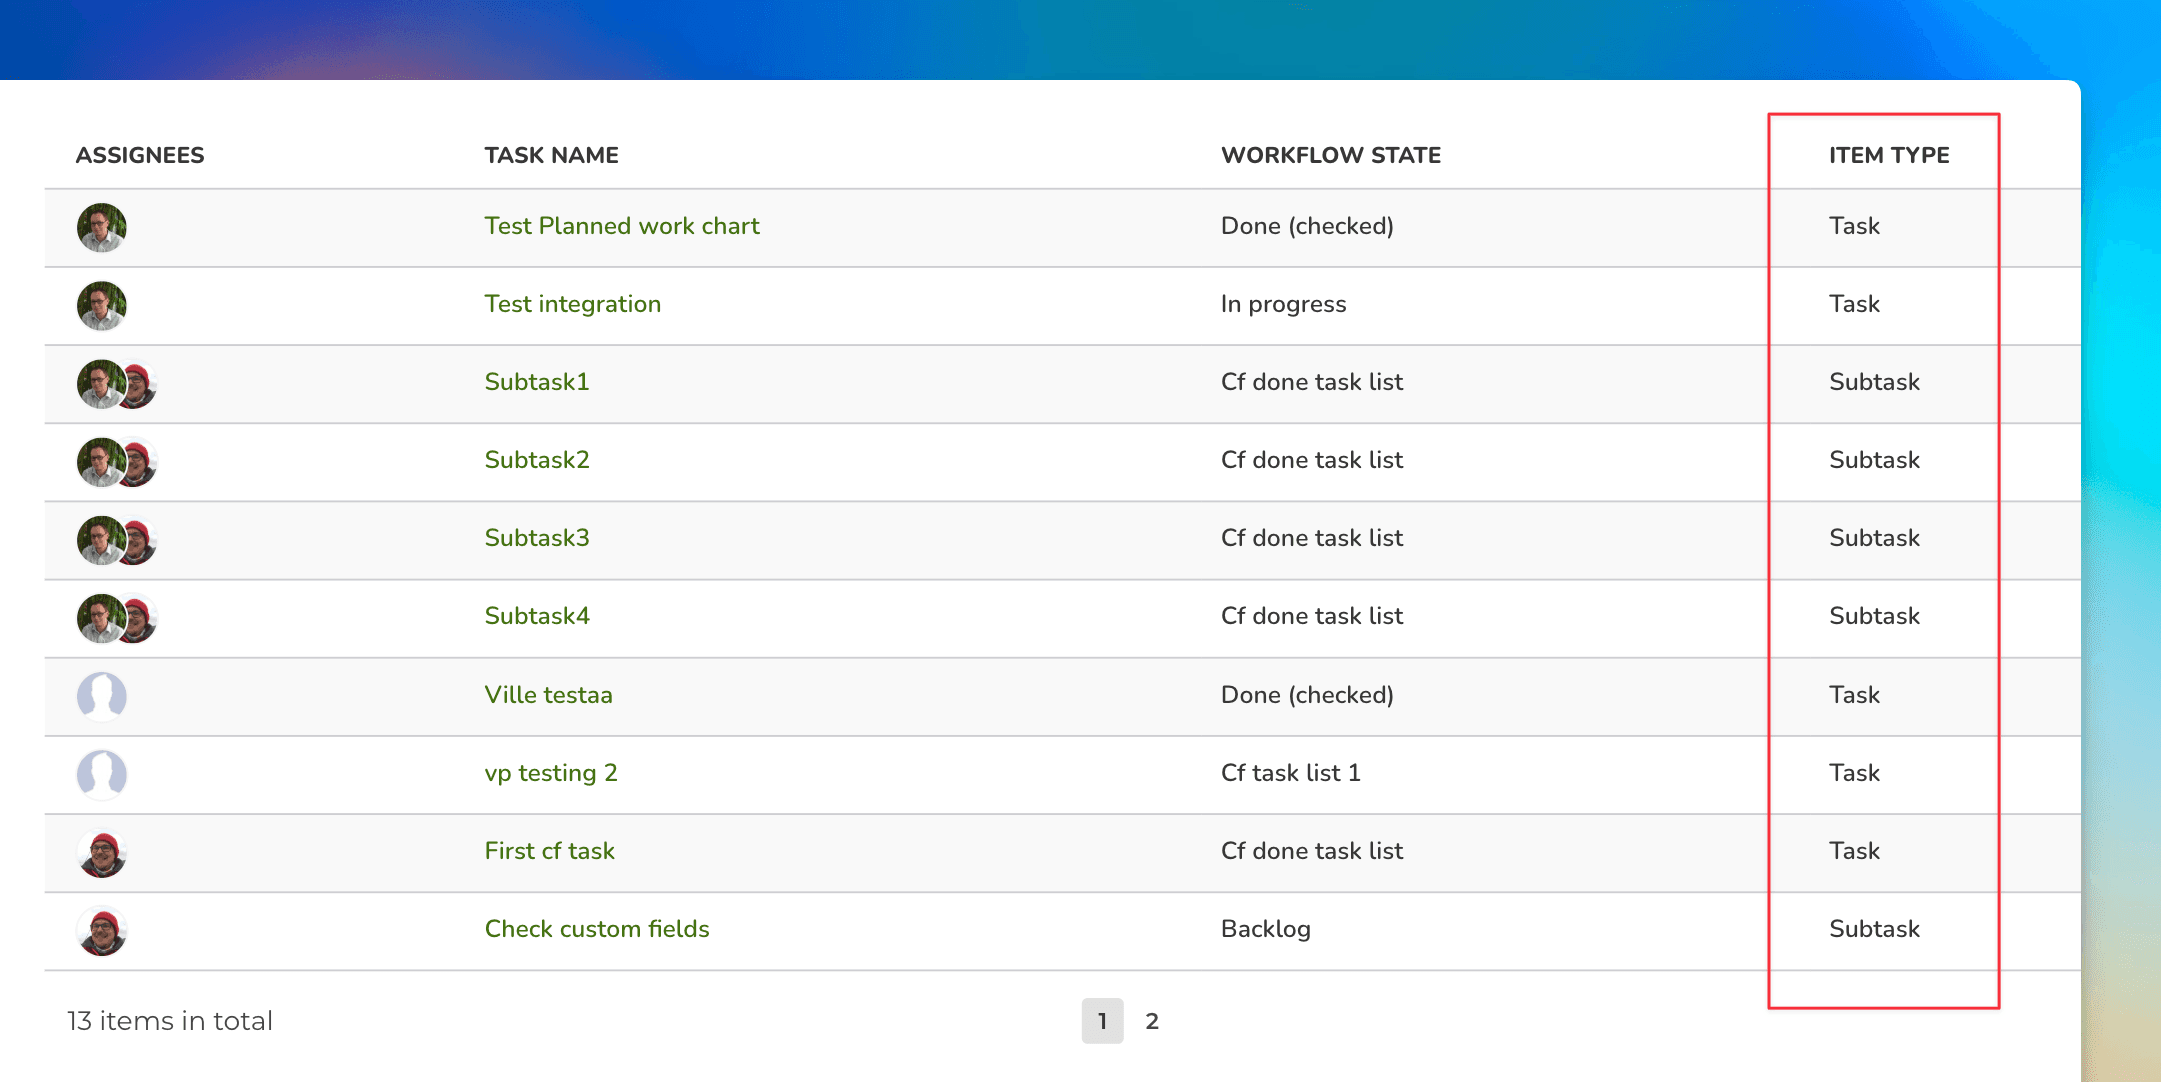
The rightmost column shows the item type: Task or Subtask.
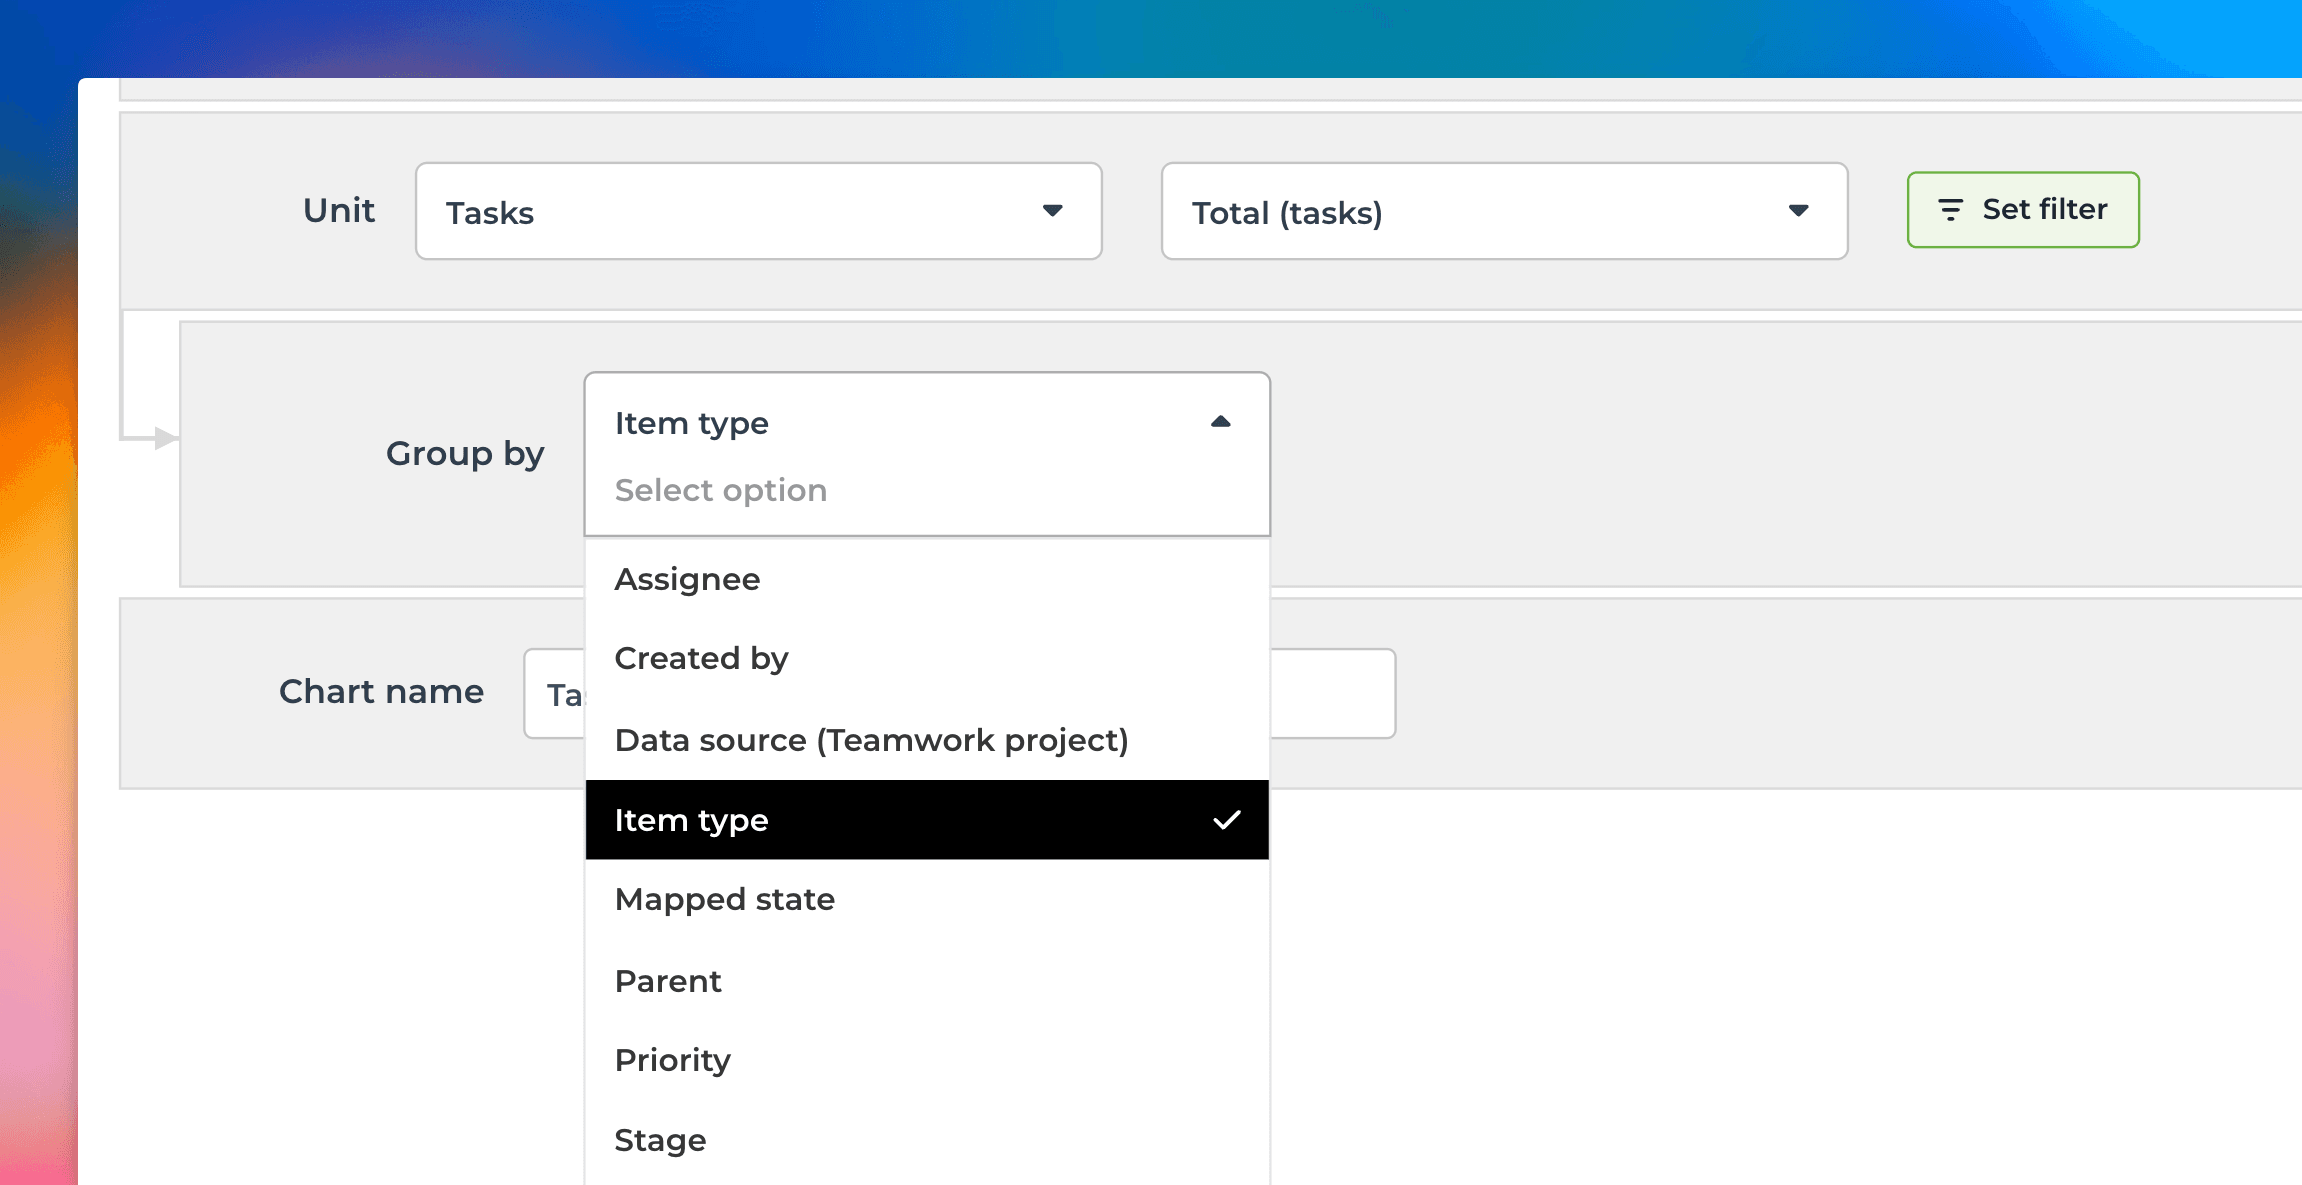
With the charts that support grouping, such as pie chart or bar chart, you can group data by item type. This shows the distribution of your tasks and subtasks in your data:
Here’s an example bar chart, grouped by the item type:
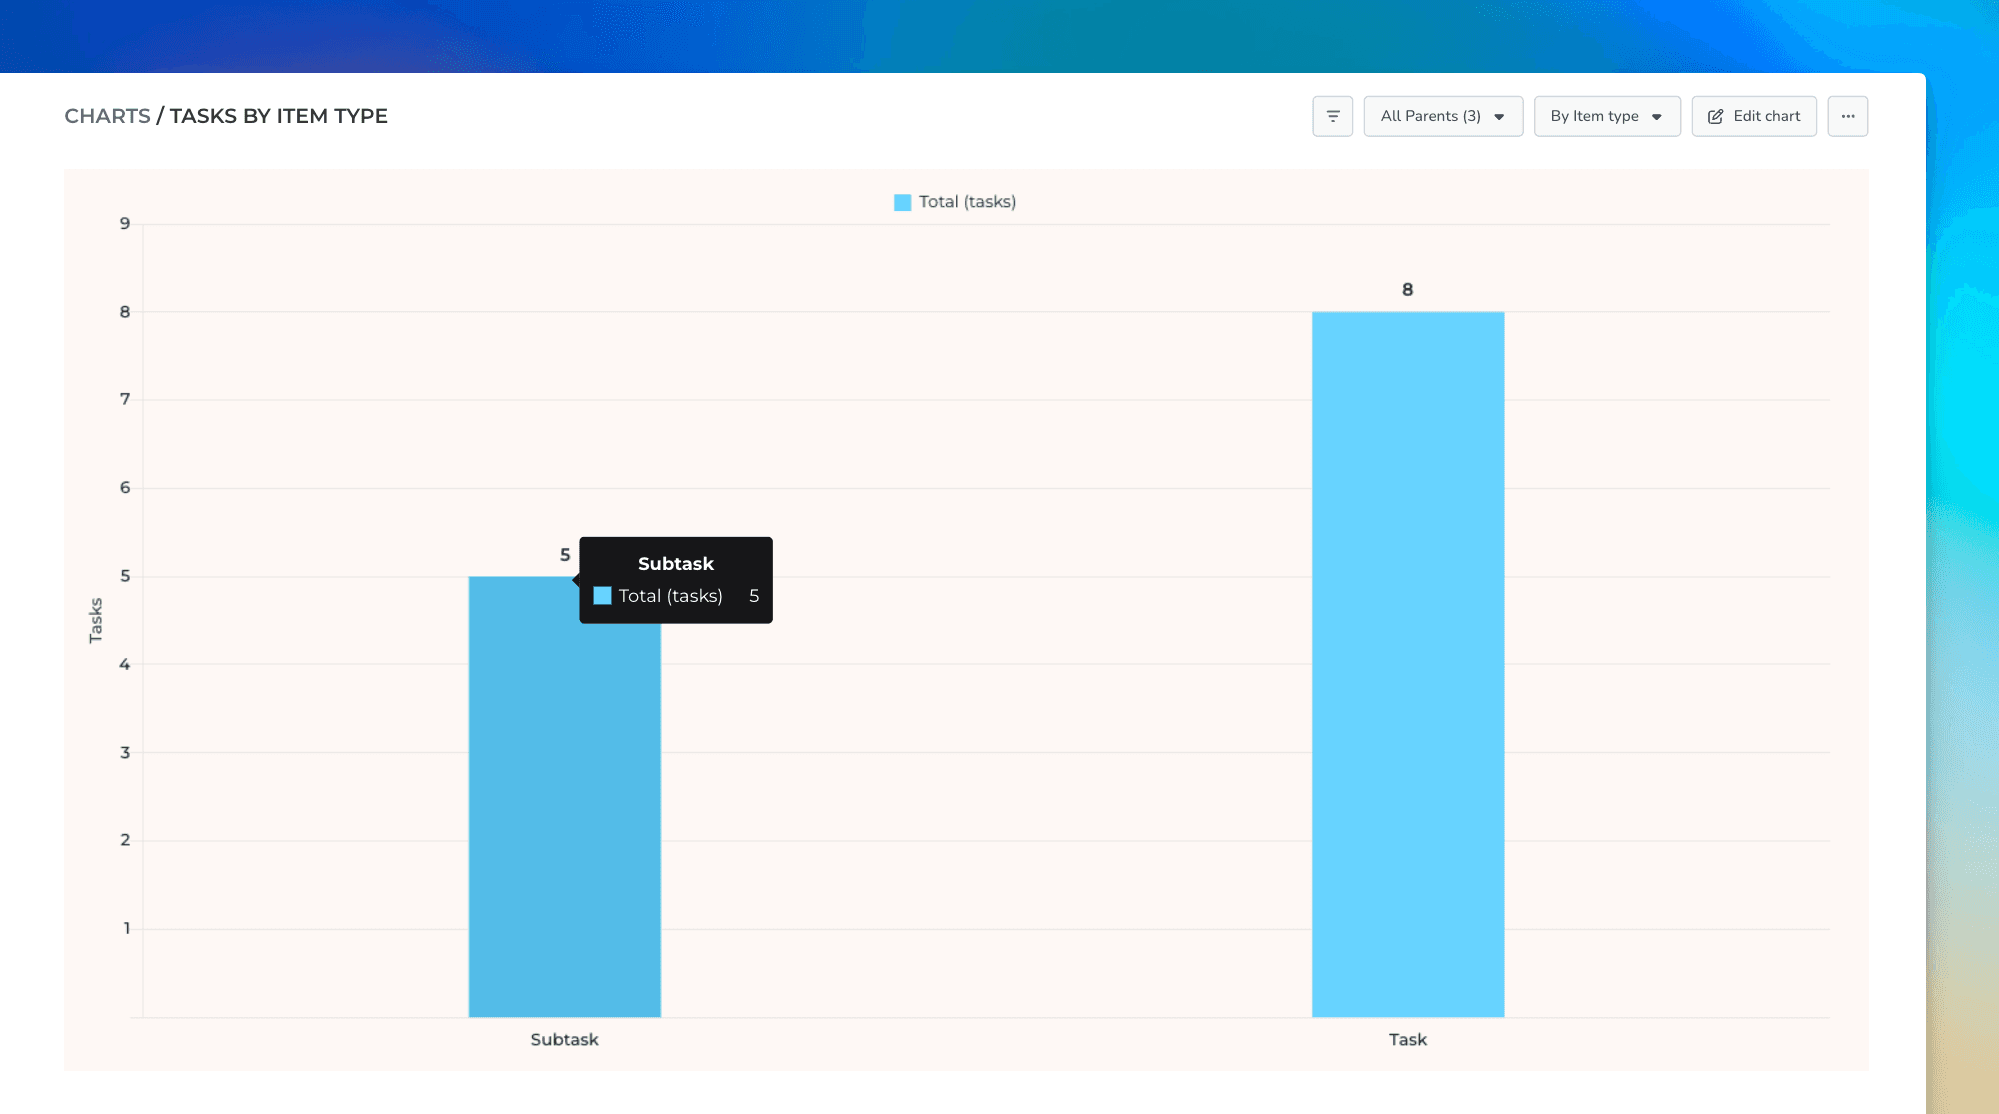
Charts are clickable. You can click a bar to drill into the individual tasks.
Rolling up values form subitems
You can roll up values from subtasks by selecting Parent as the row in the Table chart.
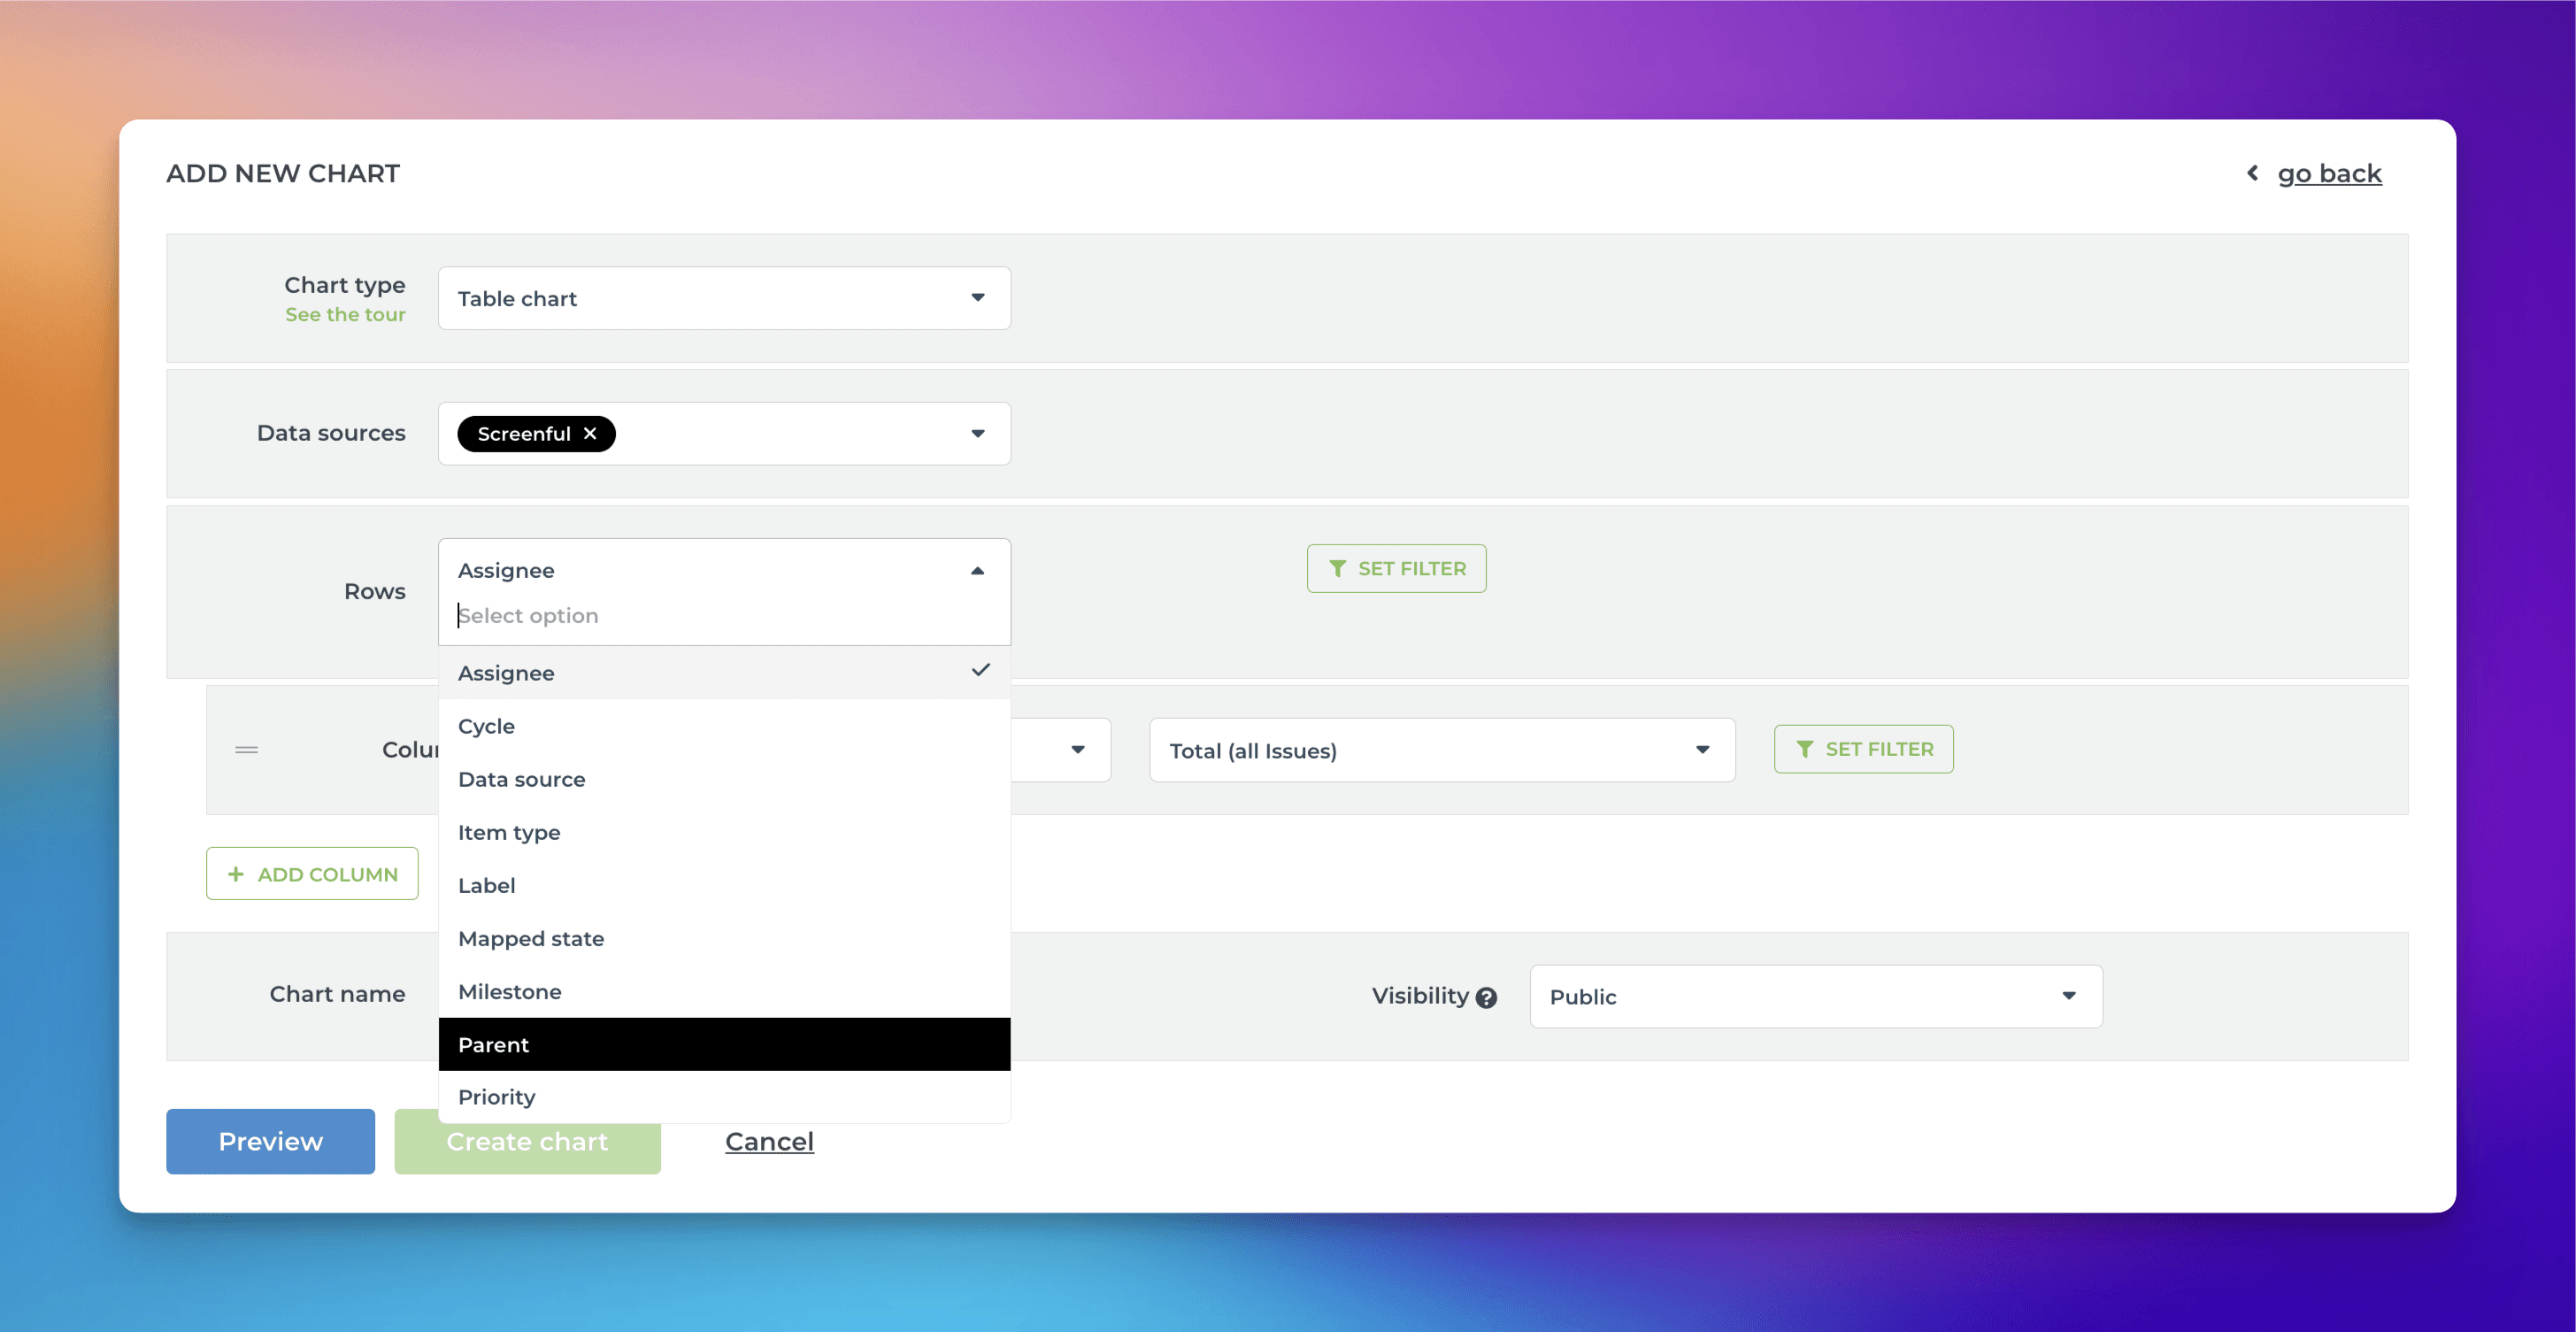
Now each row in the table corresponds to the top-level task, and the metrics shown in columns are the summaries from the subtasks. For example, a column can show the total number of subtasks for a parent, the total number of completed subtasks, or the number of story points assigned to subtasks.
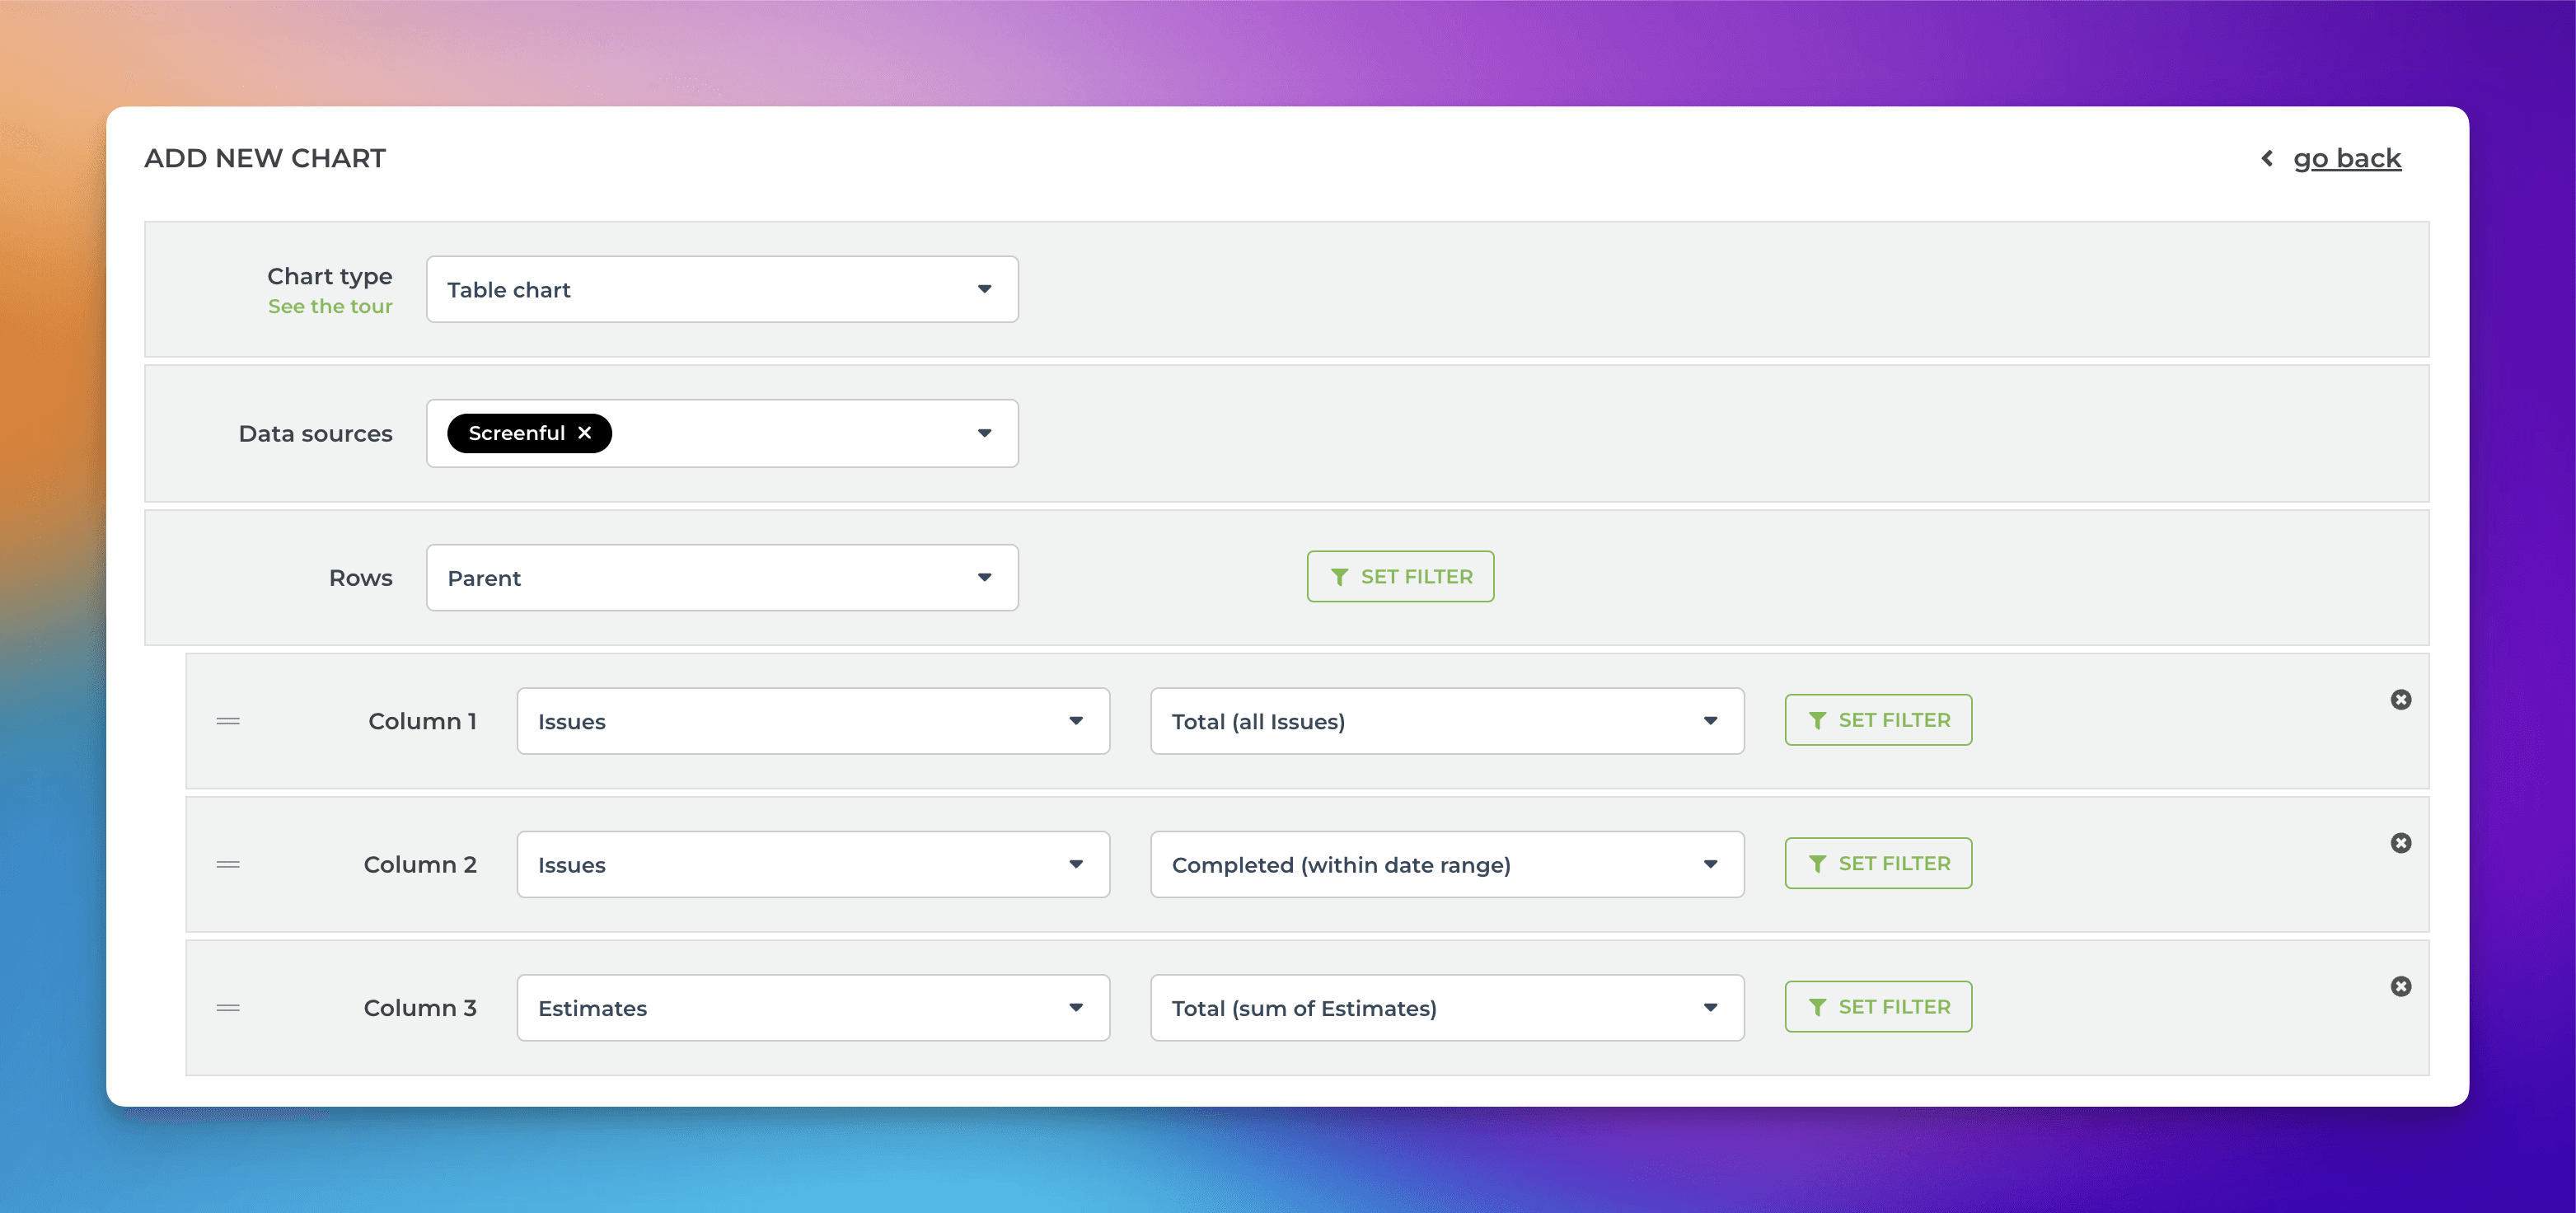
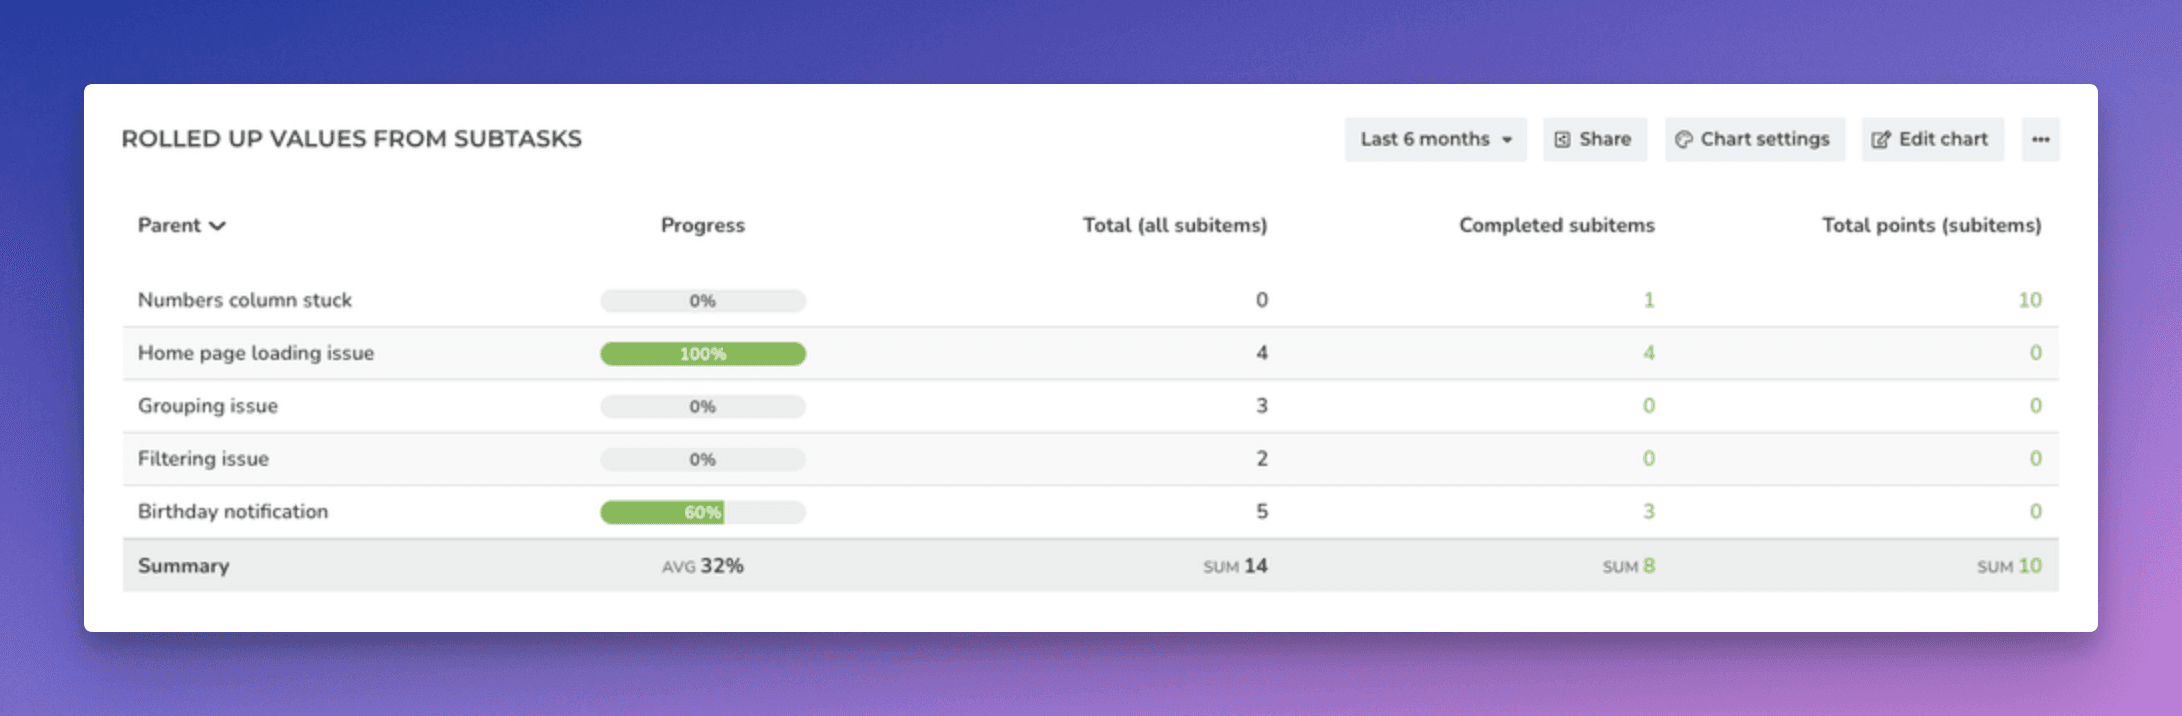
The columns are configurable, so you can roll up any available metrics from subtasks. The progress bar can be used to show the completion percentage of the subtasks. It can be added to the chart by applying a formula:
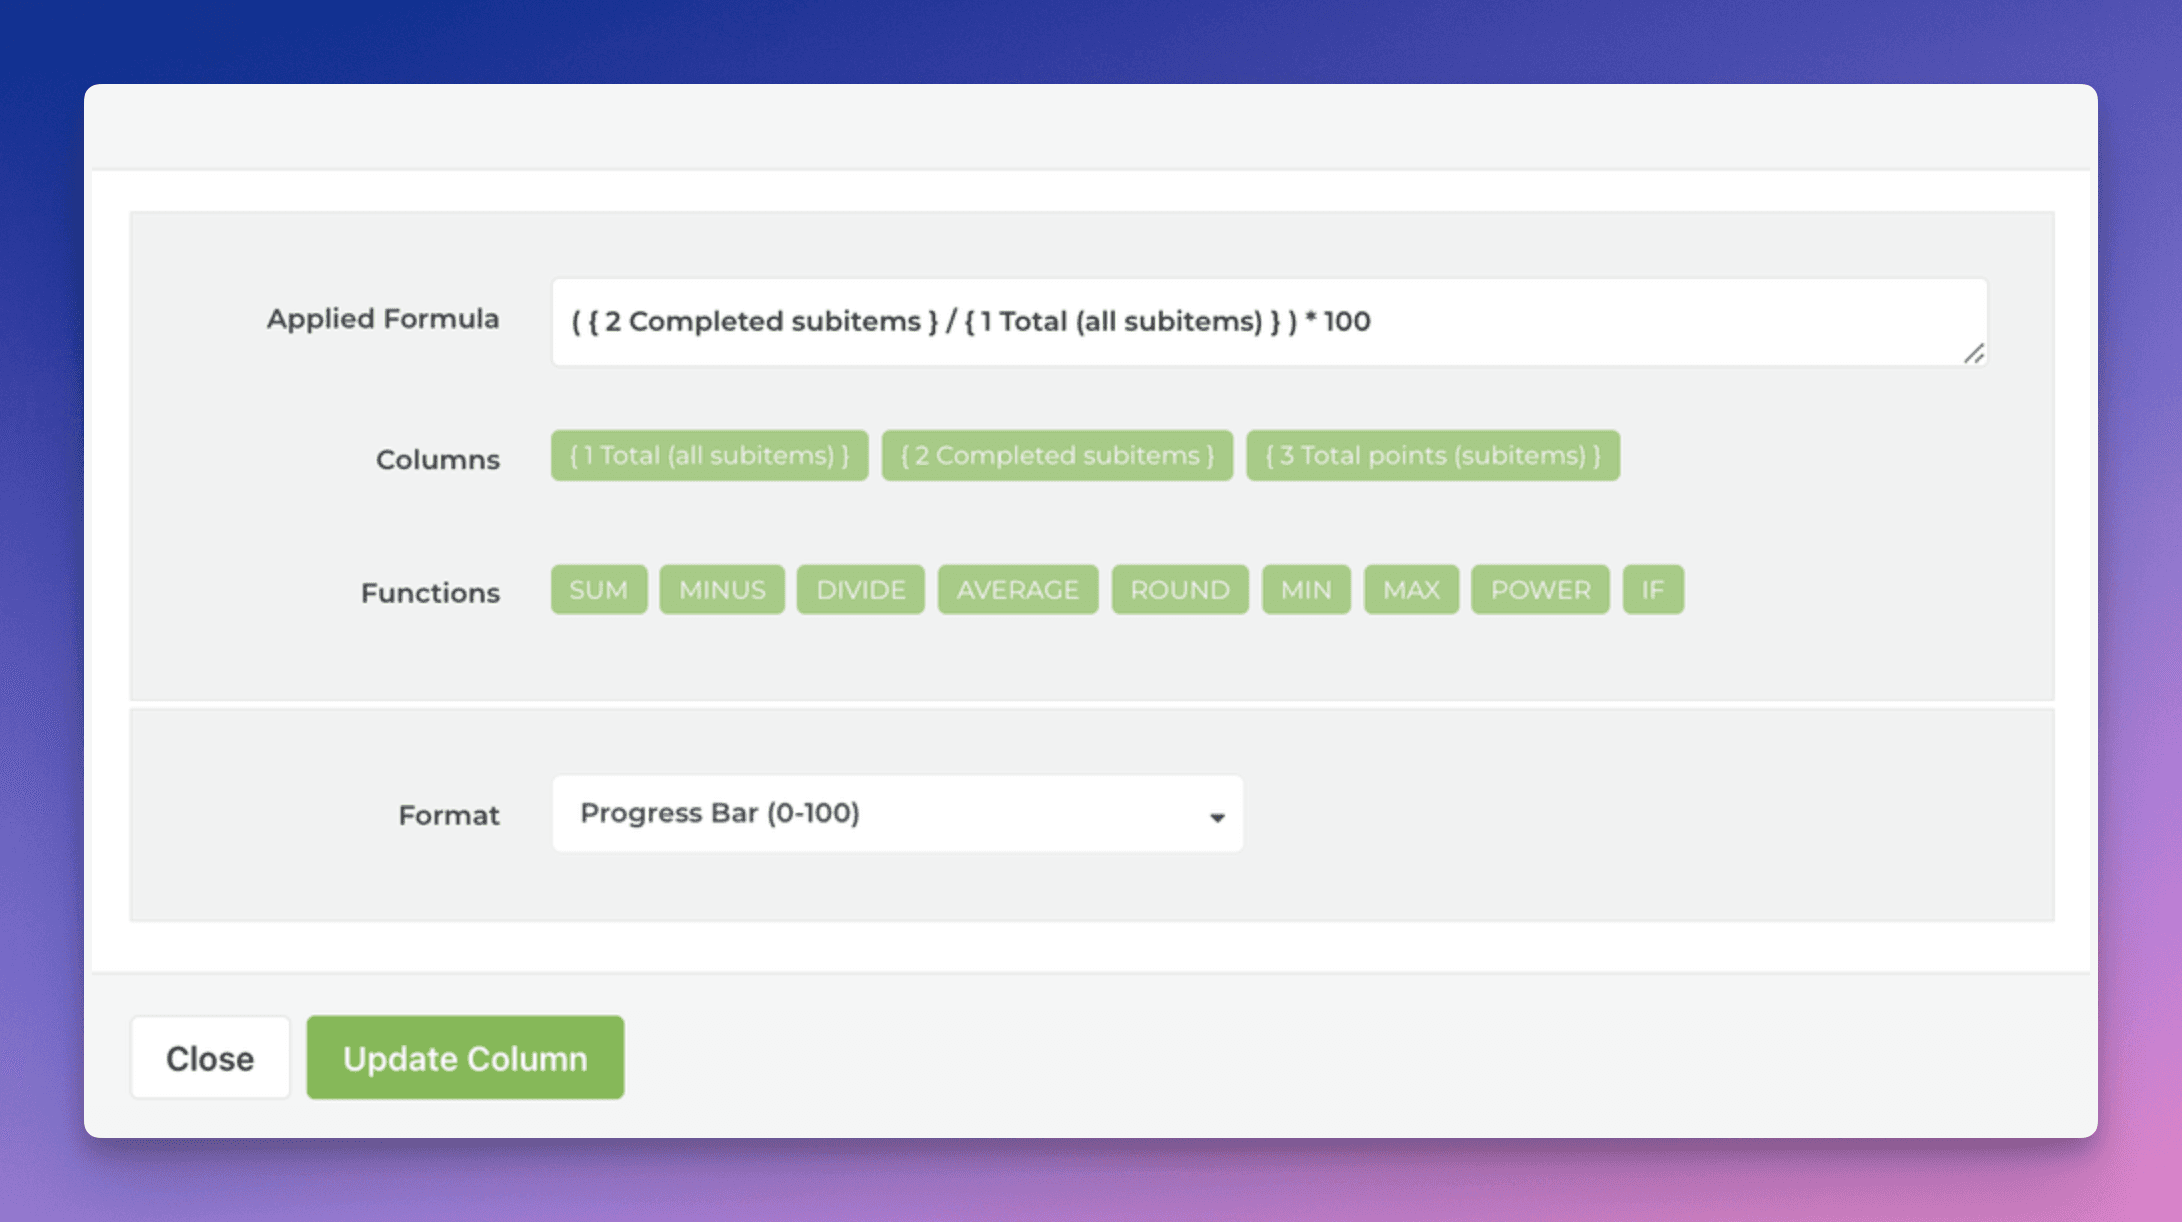
Here’s the final chart:
Filtering by item type
In the chart settings, you can include or exclude subitems using the “Item type” filter:


Similarly, you can also filter by subitems’ parents:

Learn more
Book a free onboarding call
Need help with setting up your charts and reports? Don't find a metric you are looking for? Book a call with our expert. We'd love to help you supercharge your reporting!