Subtasks are now supported for Asana, monday.com, and Jira
Oct 30, 2022
Subtasks are now treated as first-class citizens and you can track the metrics of subtasks in addition to the top-level tasks. You can filter any of your charts to display information about your subtasks, top-level tasks, or both. You can also roll-up values from the subtasks to get summaries from the subtasks.
Creating charts from both tasks and subtasks
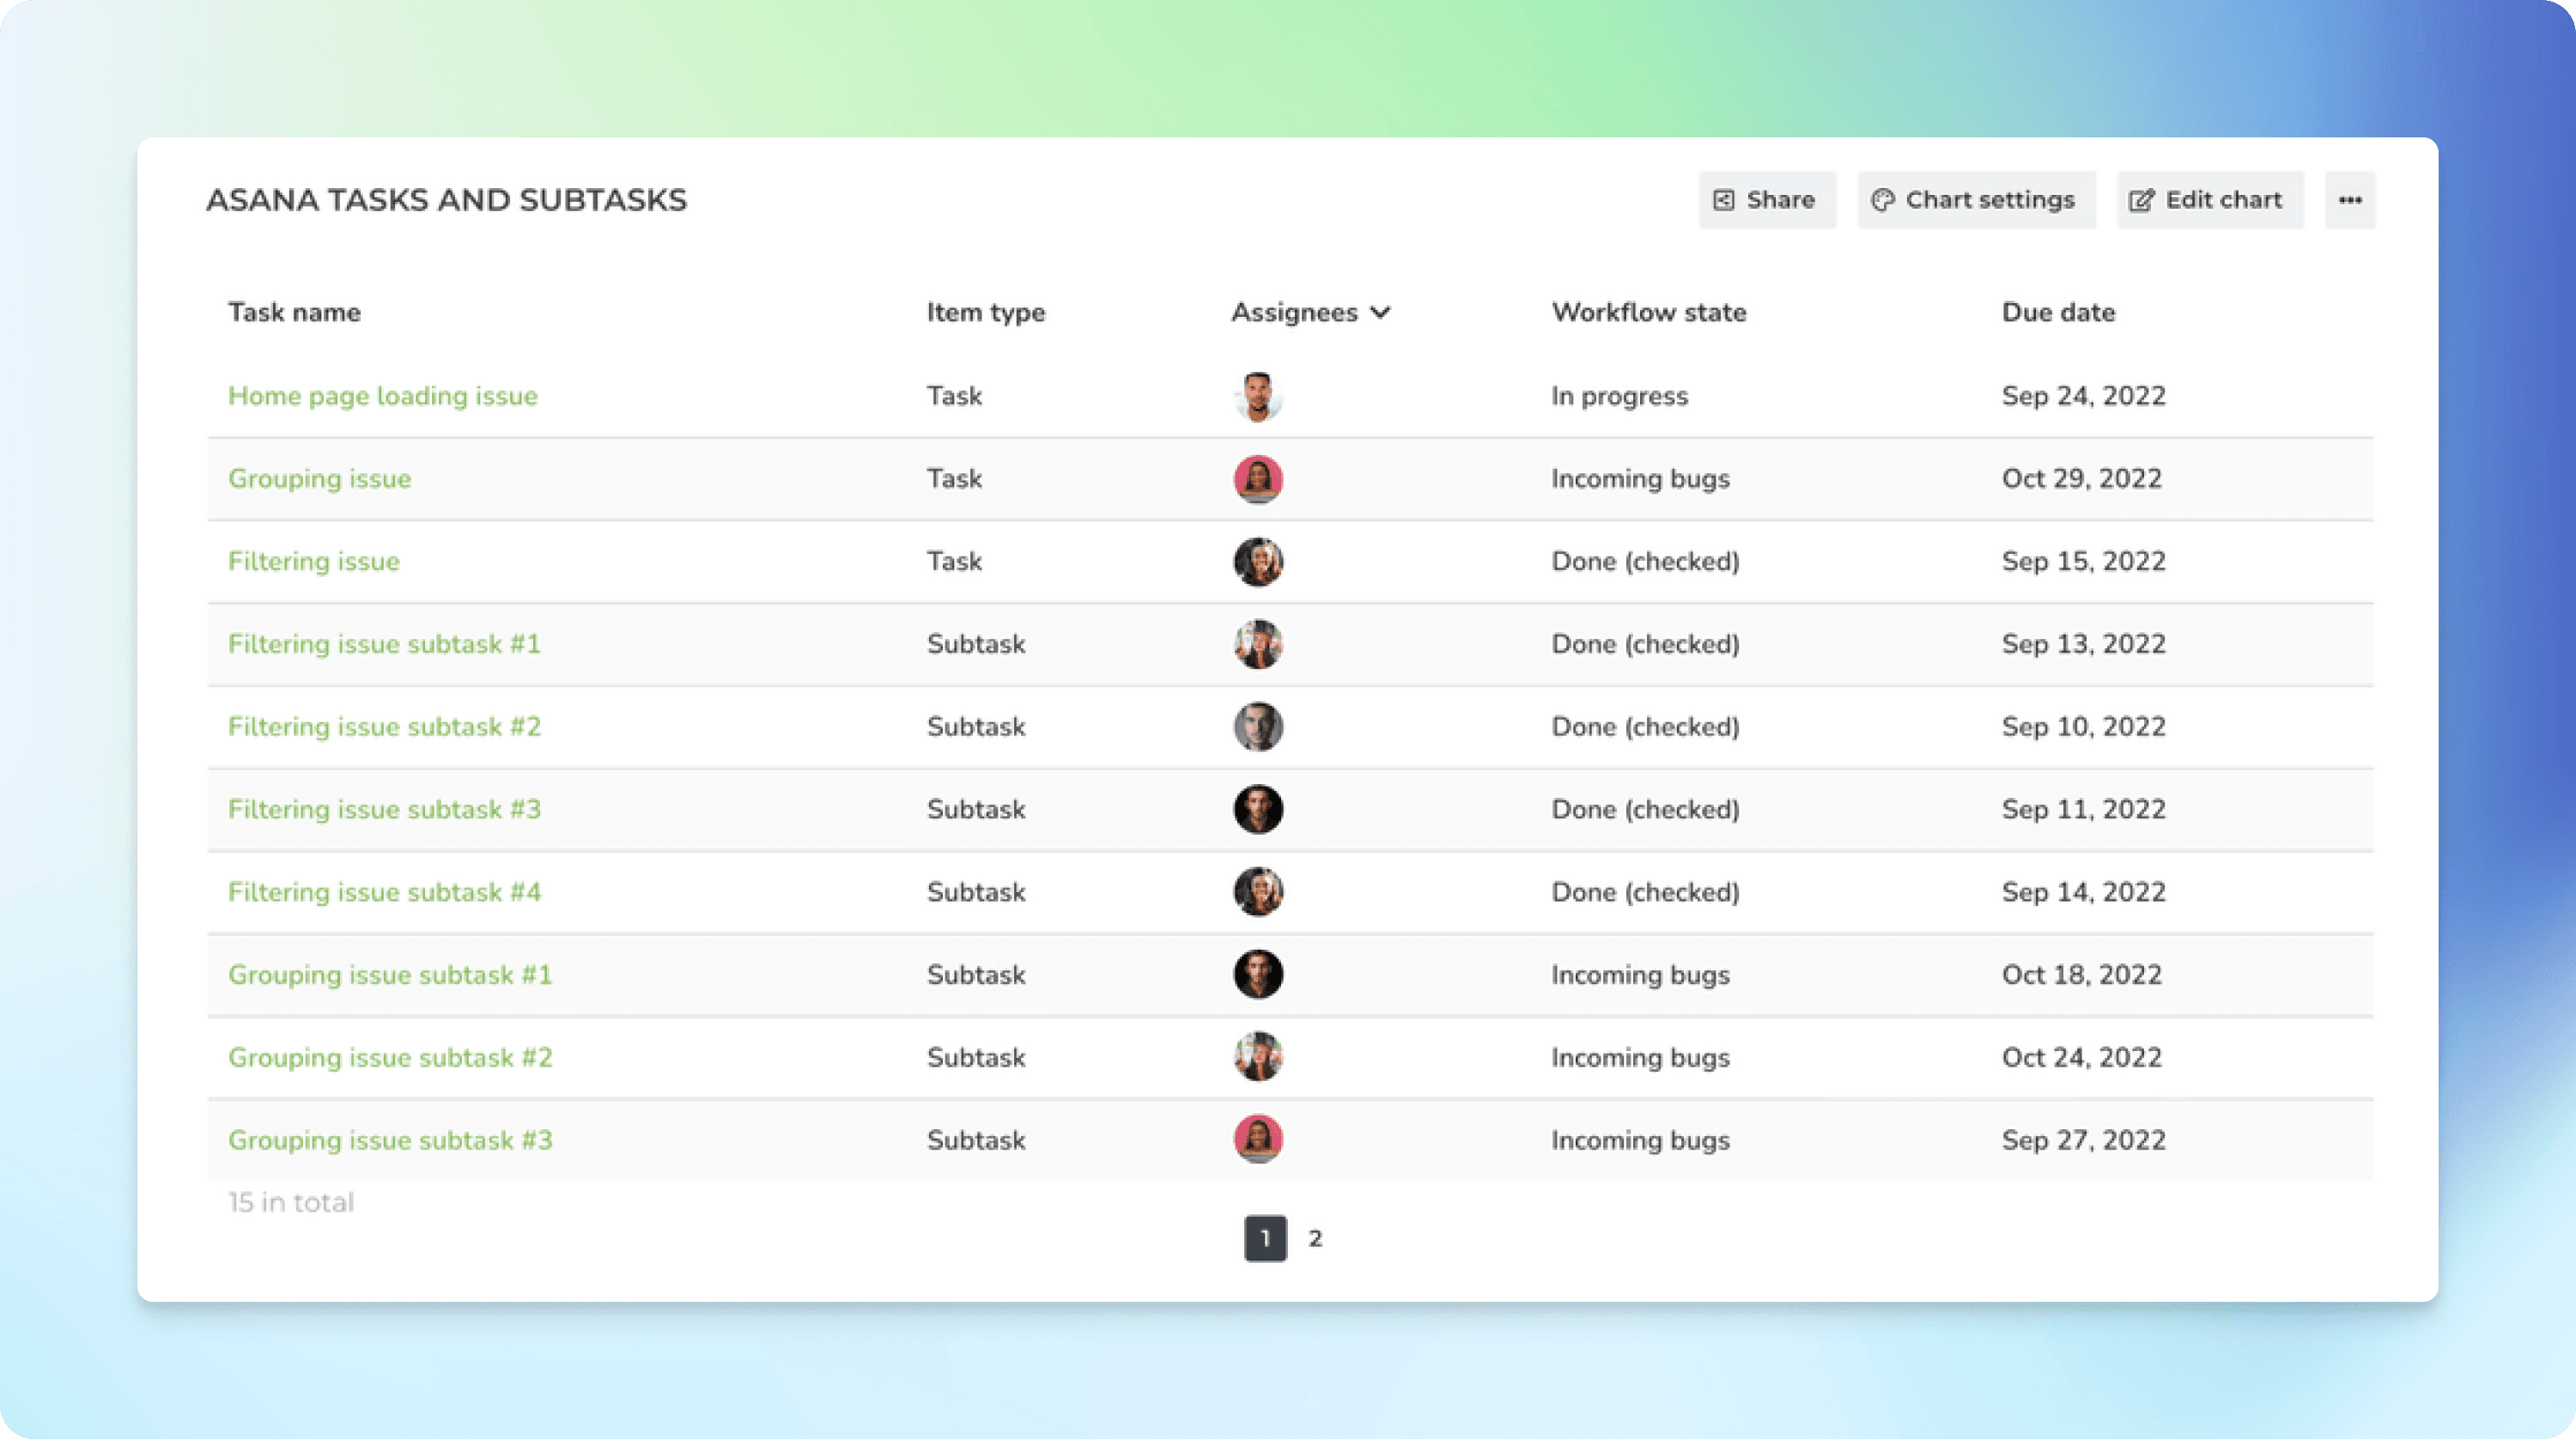
Any of the charts can display data from subtasks, top-level tasks, or both, depending on the set filter. For example, here is a task list that contains both tasks and subtasks of an Asana project:
With the charts that support grouping, you can group data by item type. This can be helpful if you want to track the number of tasks and subtasks in your projects:
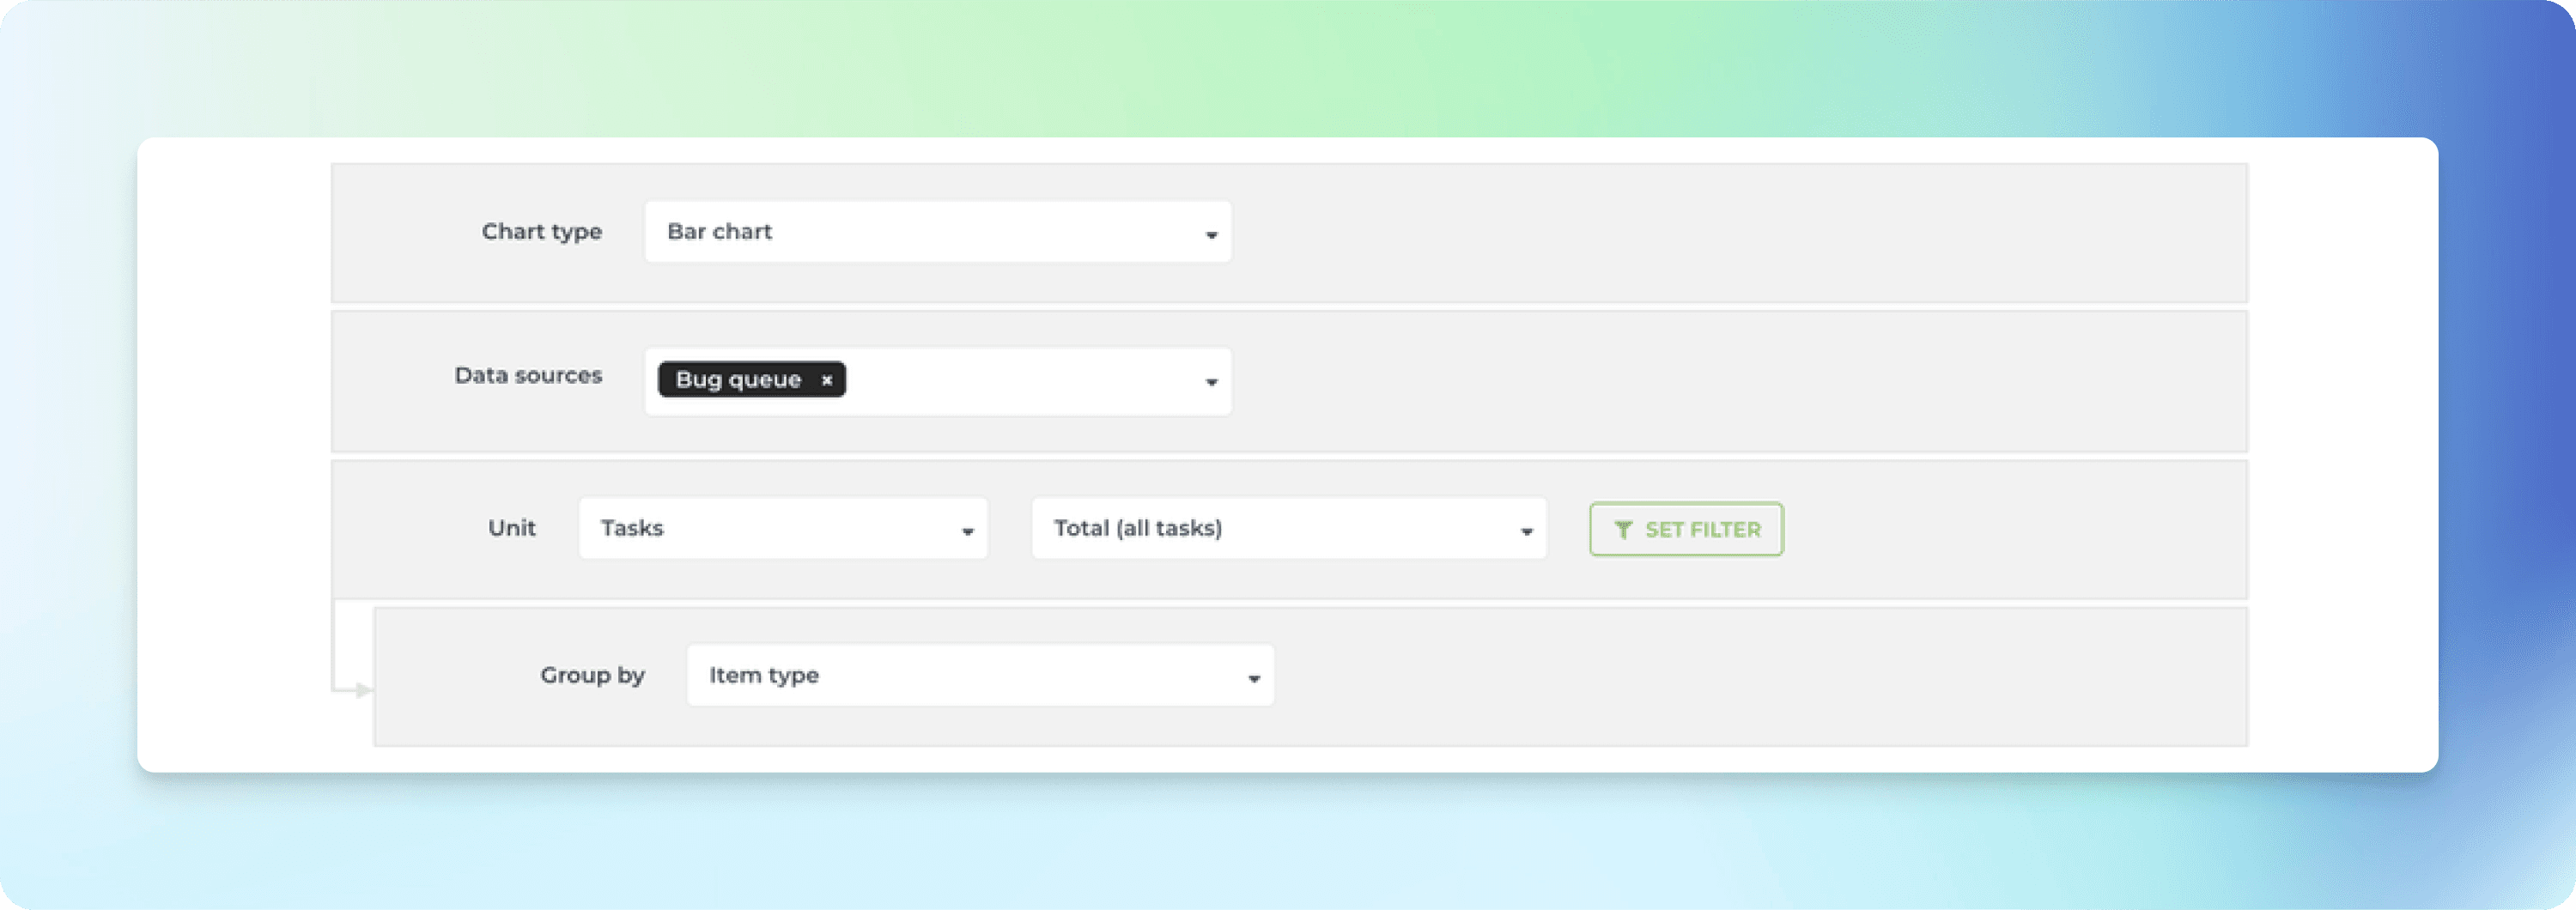
Here’s the resulting chart, grouped by item type:
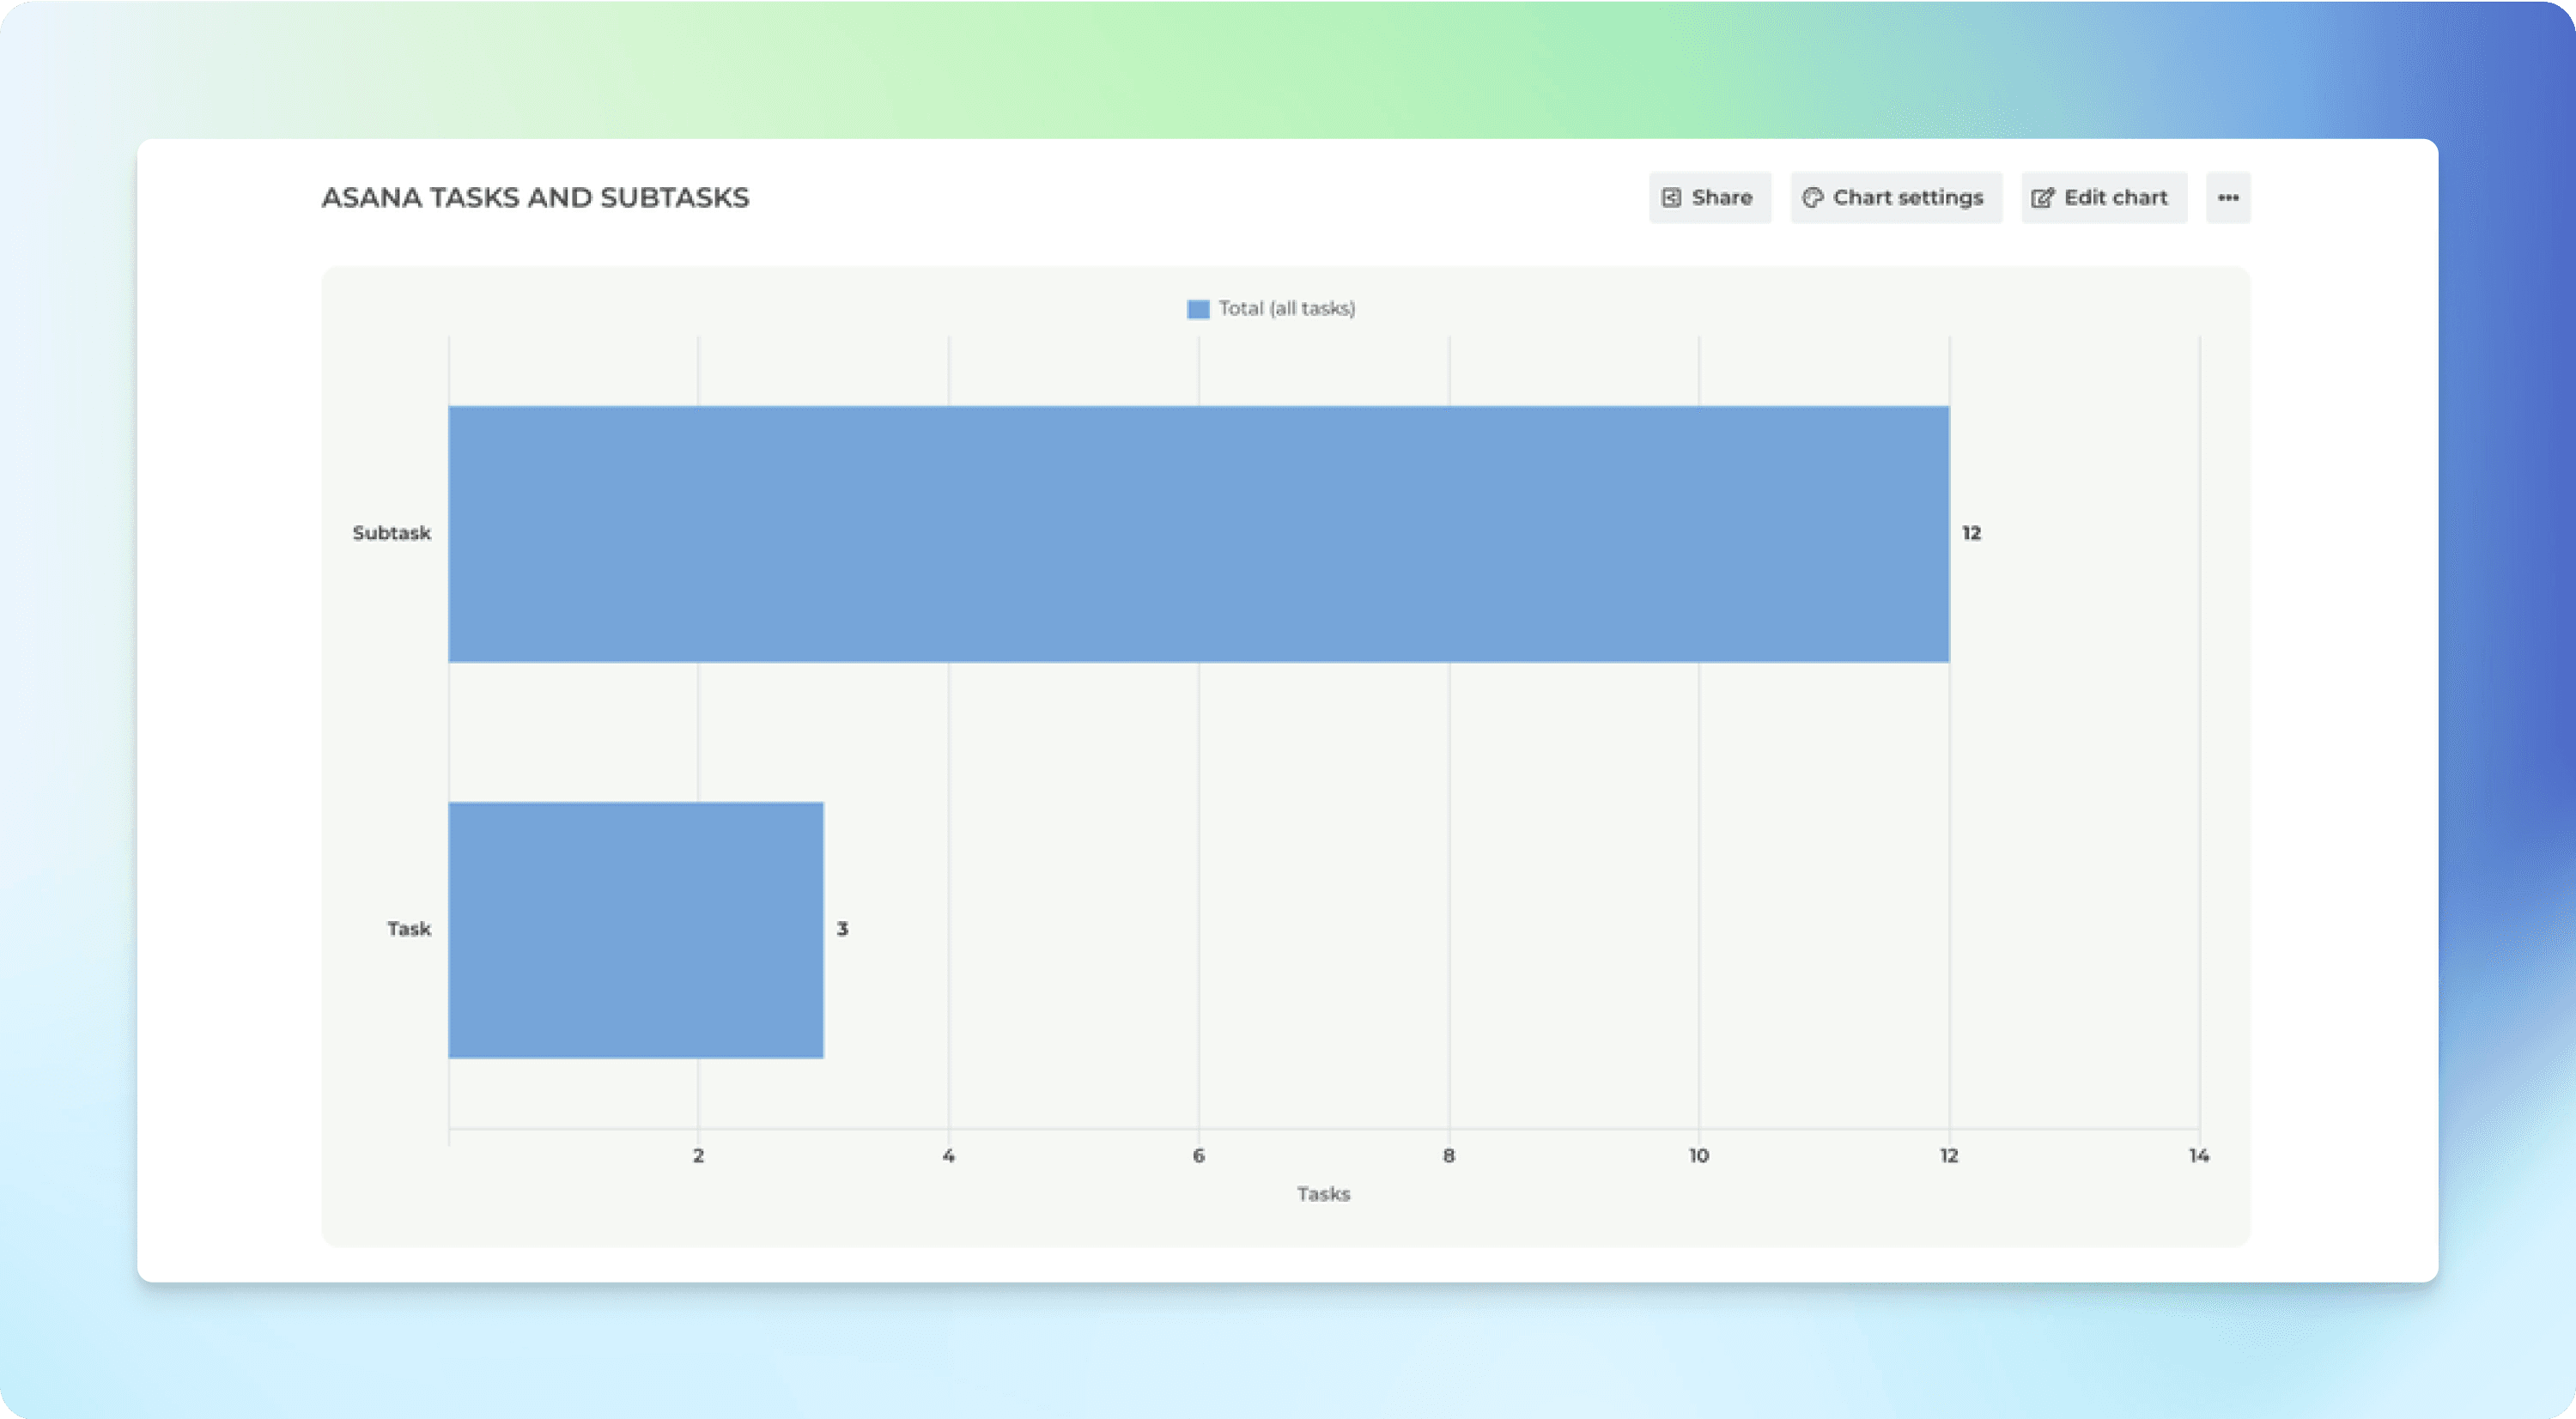
The bars in the chart show the number of Tasks and Subtasks in the selected data sources.
Rolling up values from subtasks
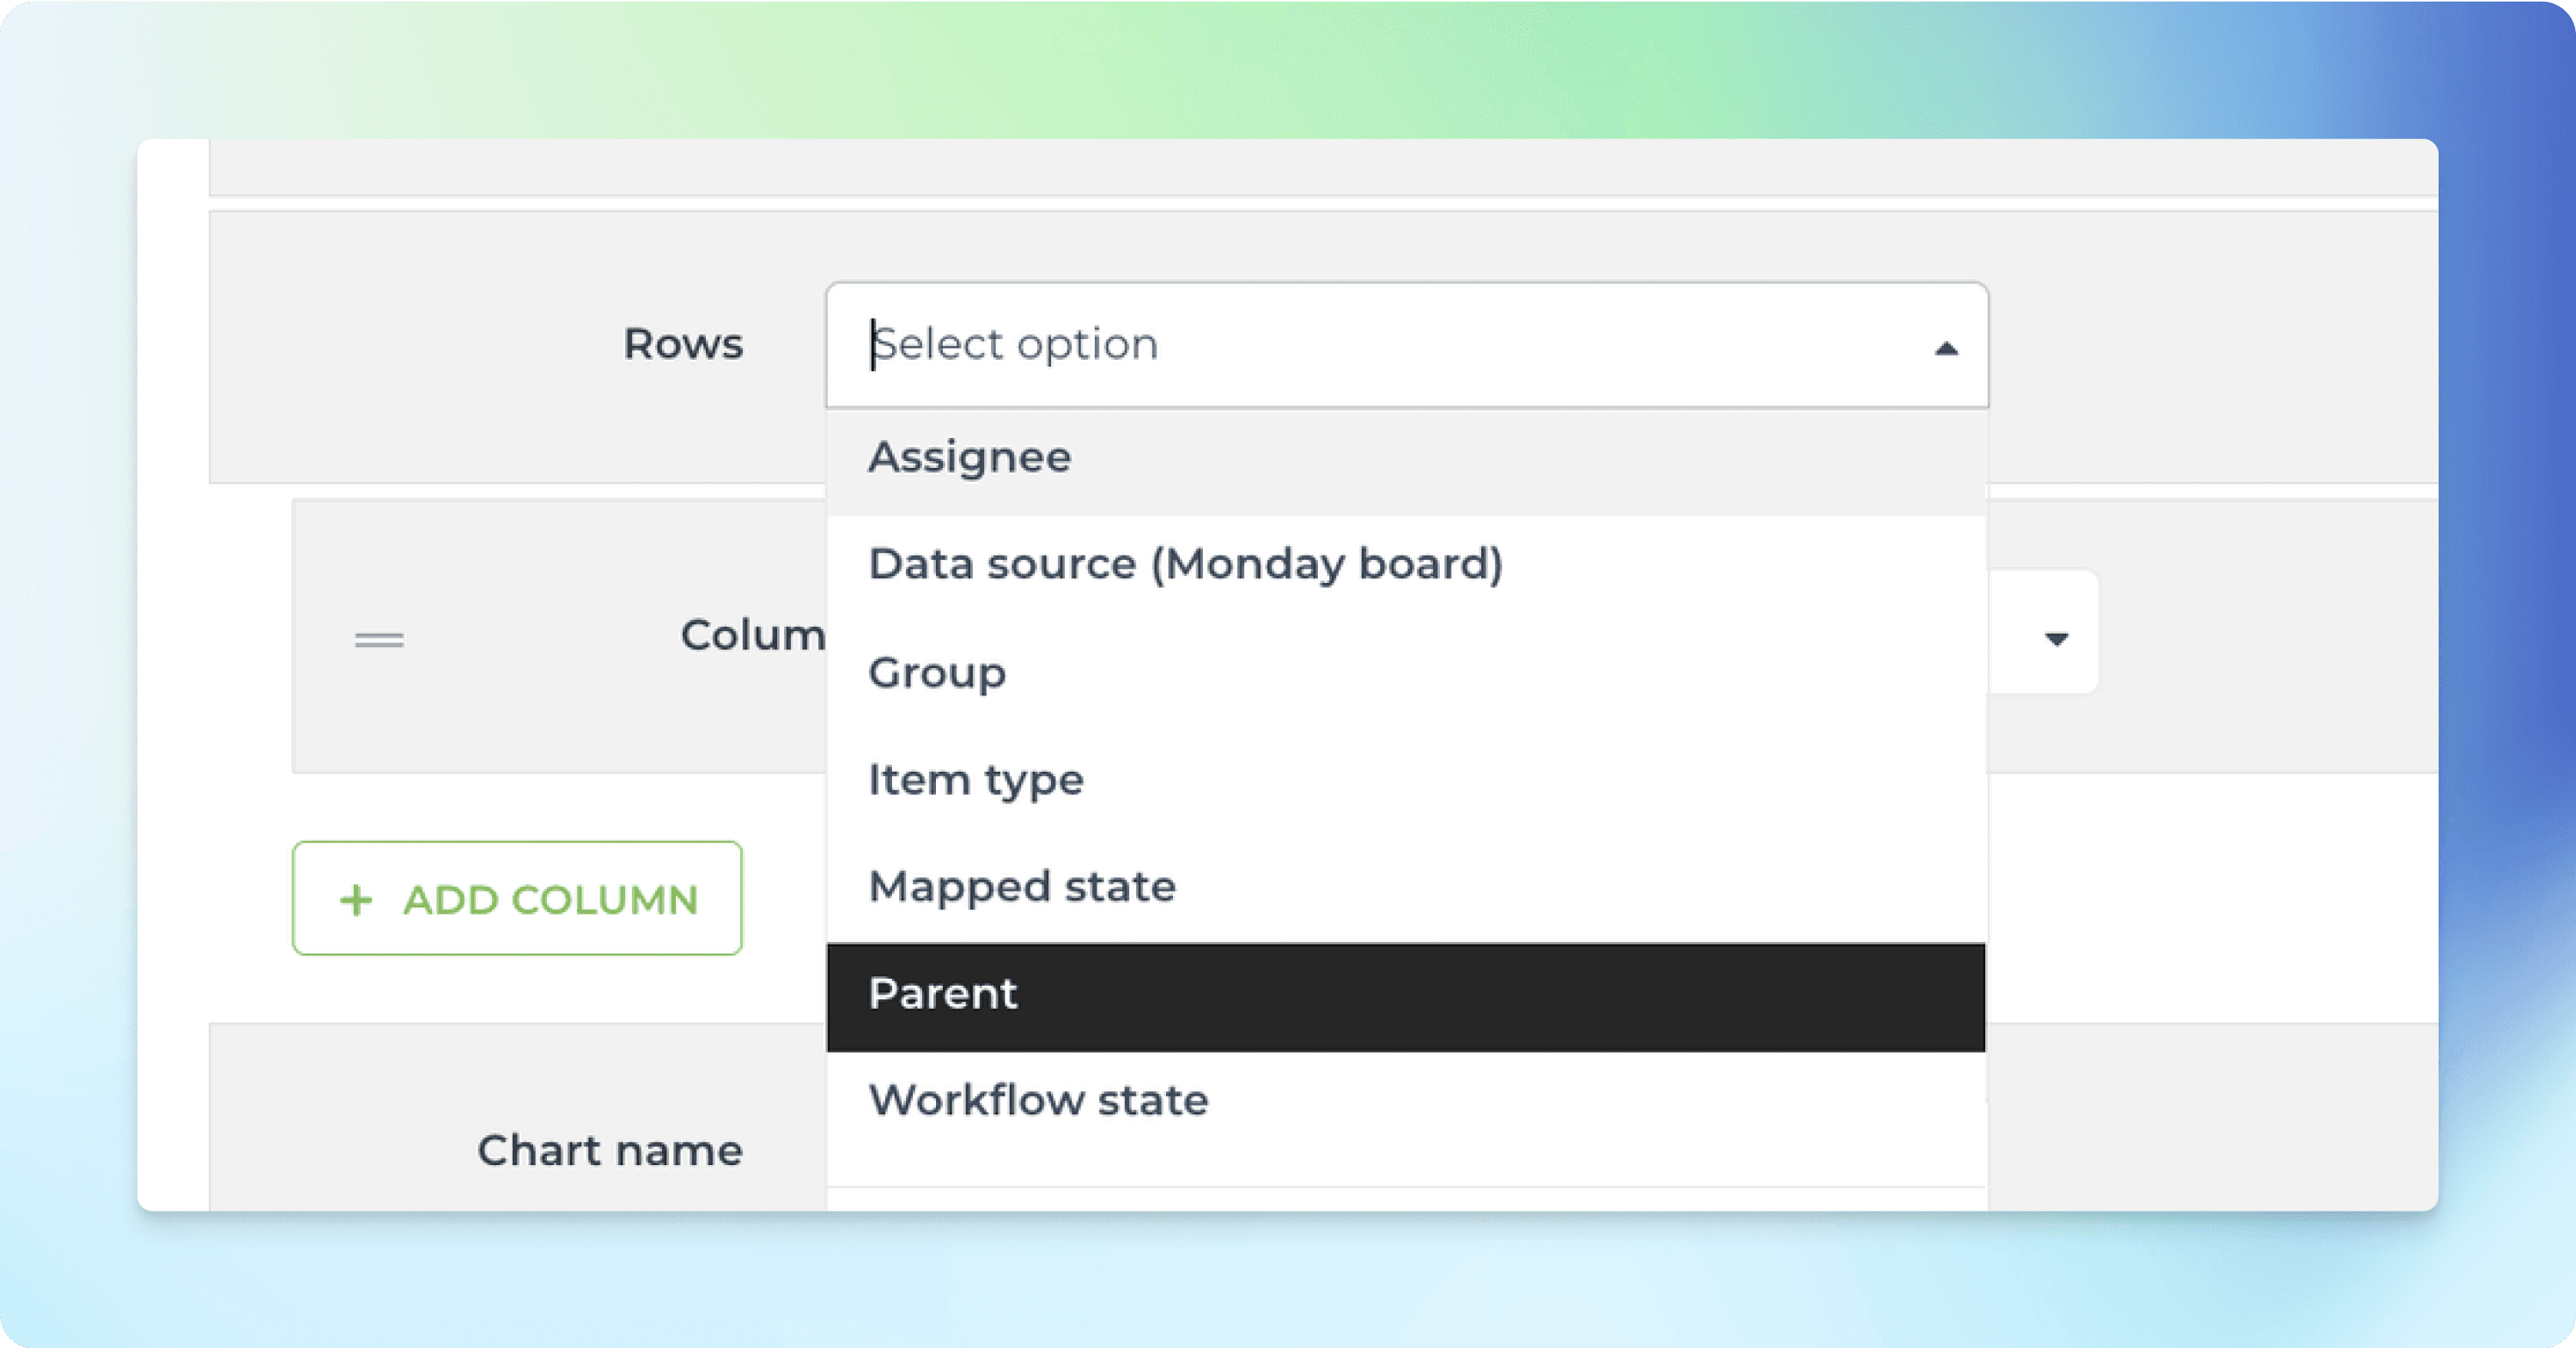
You can roll up values from subitems by selecting Parent as the row in the Table chart.
Now each row in the table corresponds to a top-level task, and the metrics shown in columns are the summaries of the subtasks. For example, a column can show the total number of subtasks for a parent, the total number of completed subtasks, or the total story points assigned.
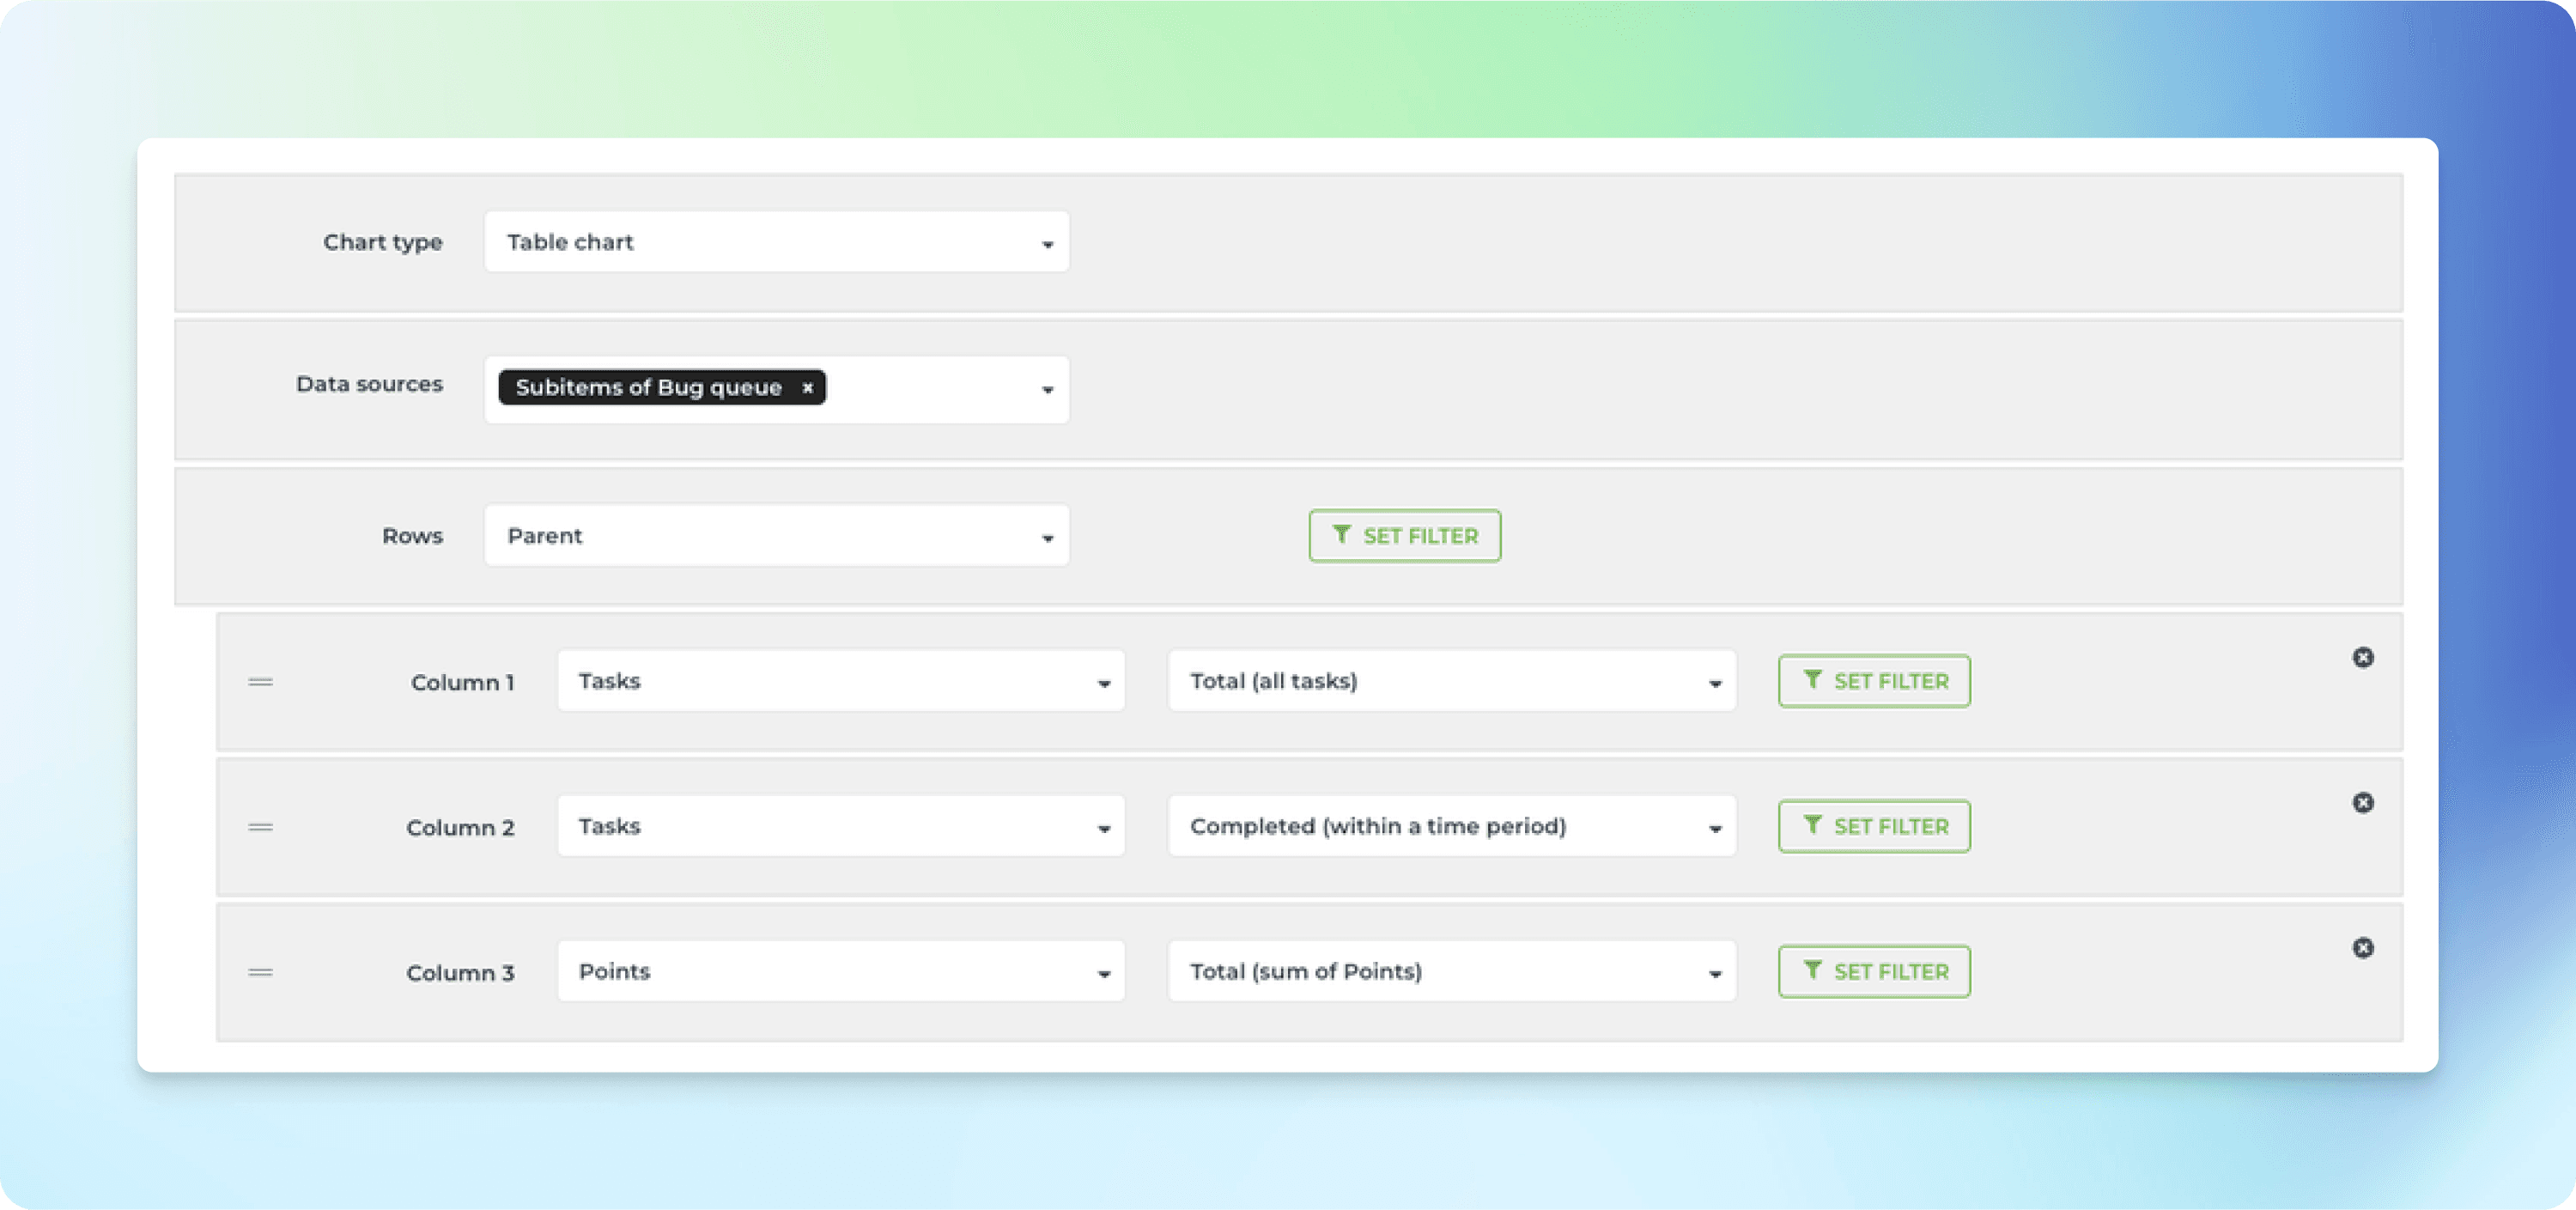
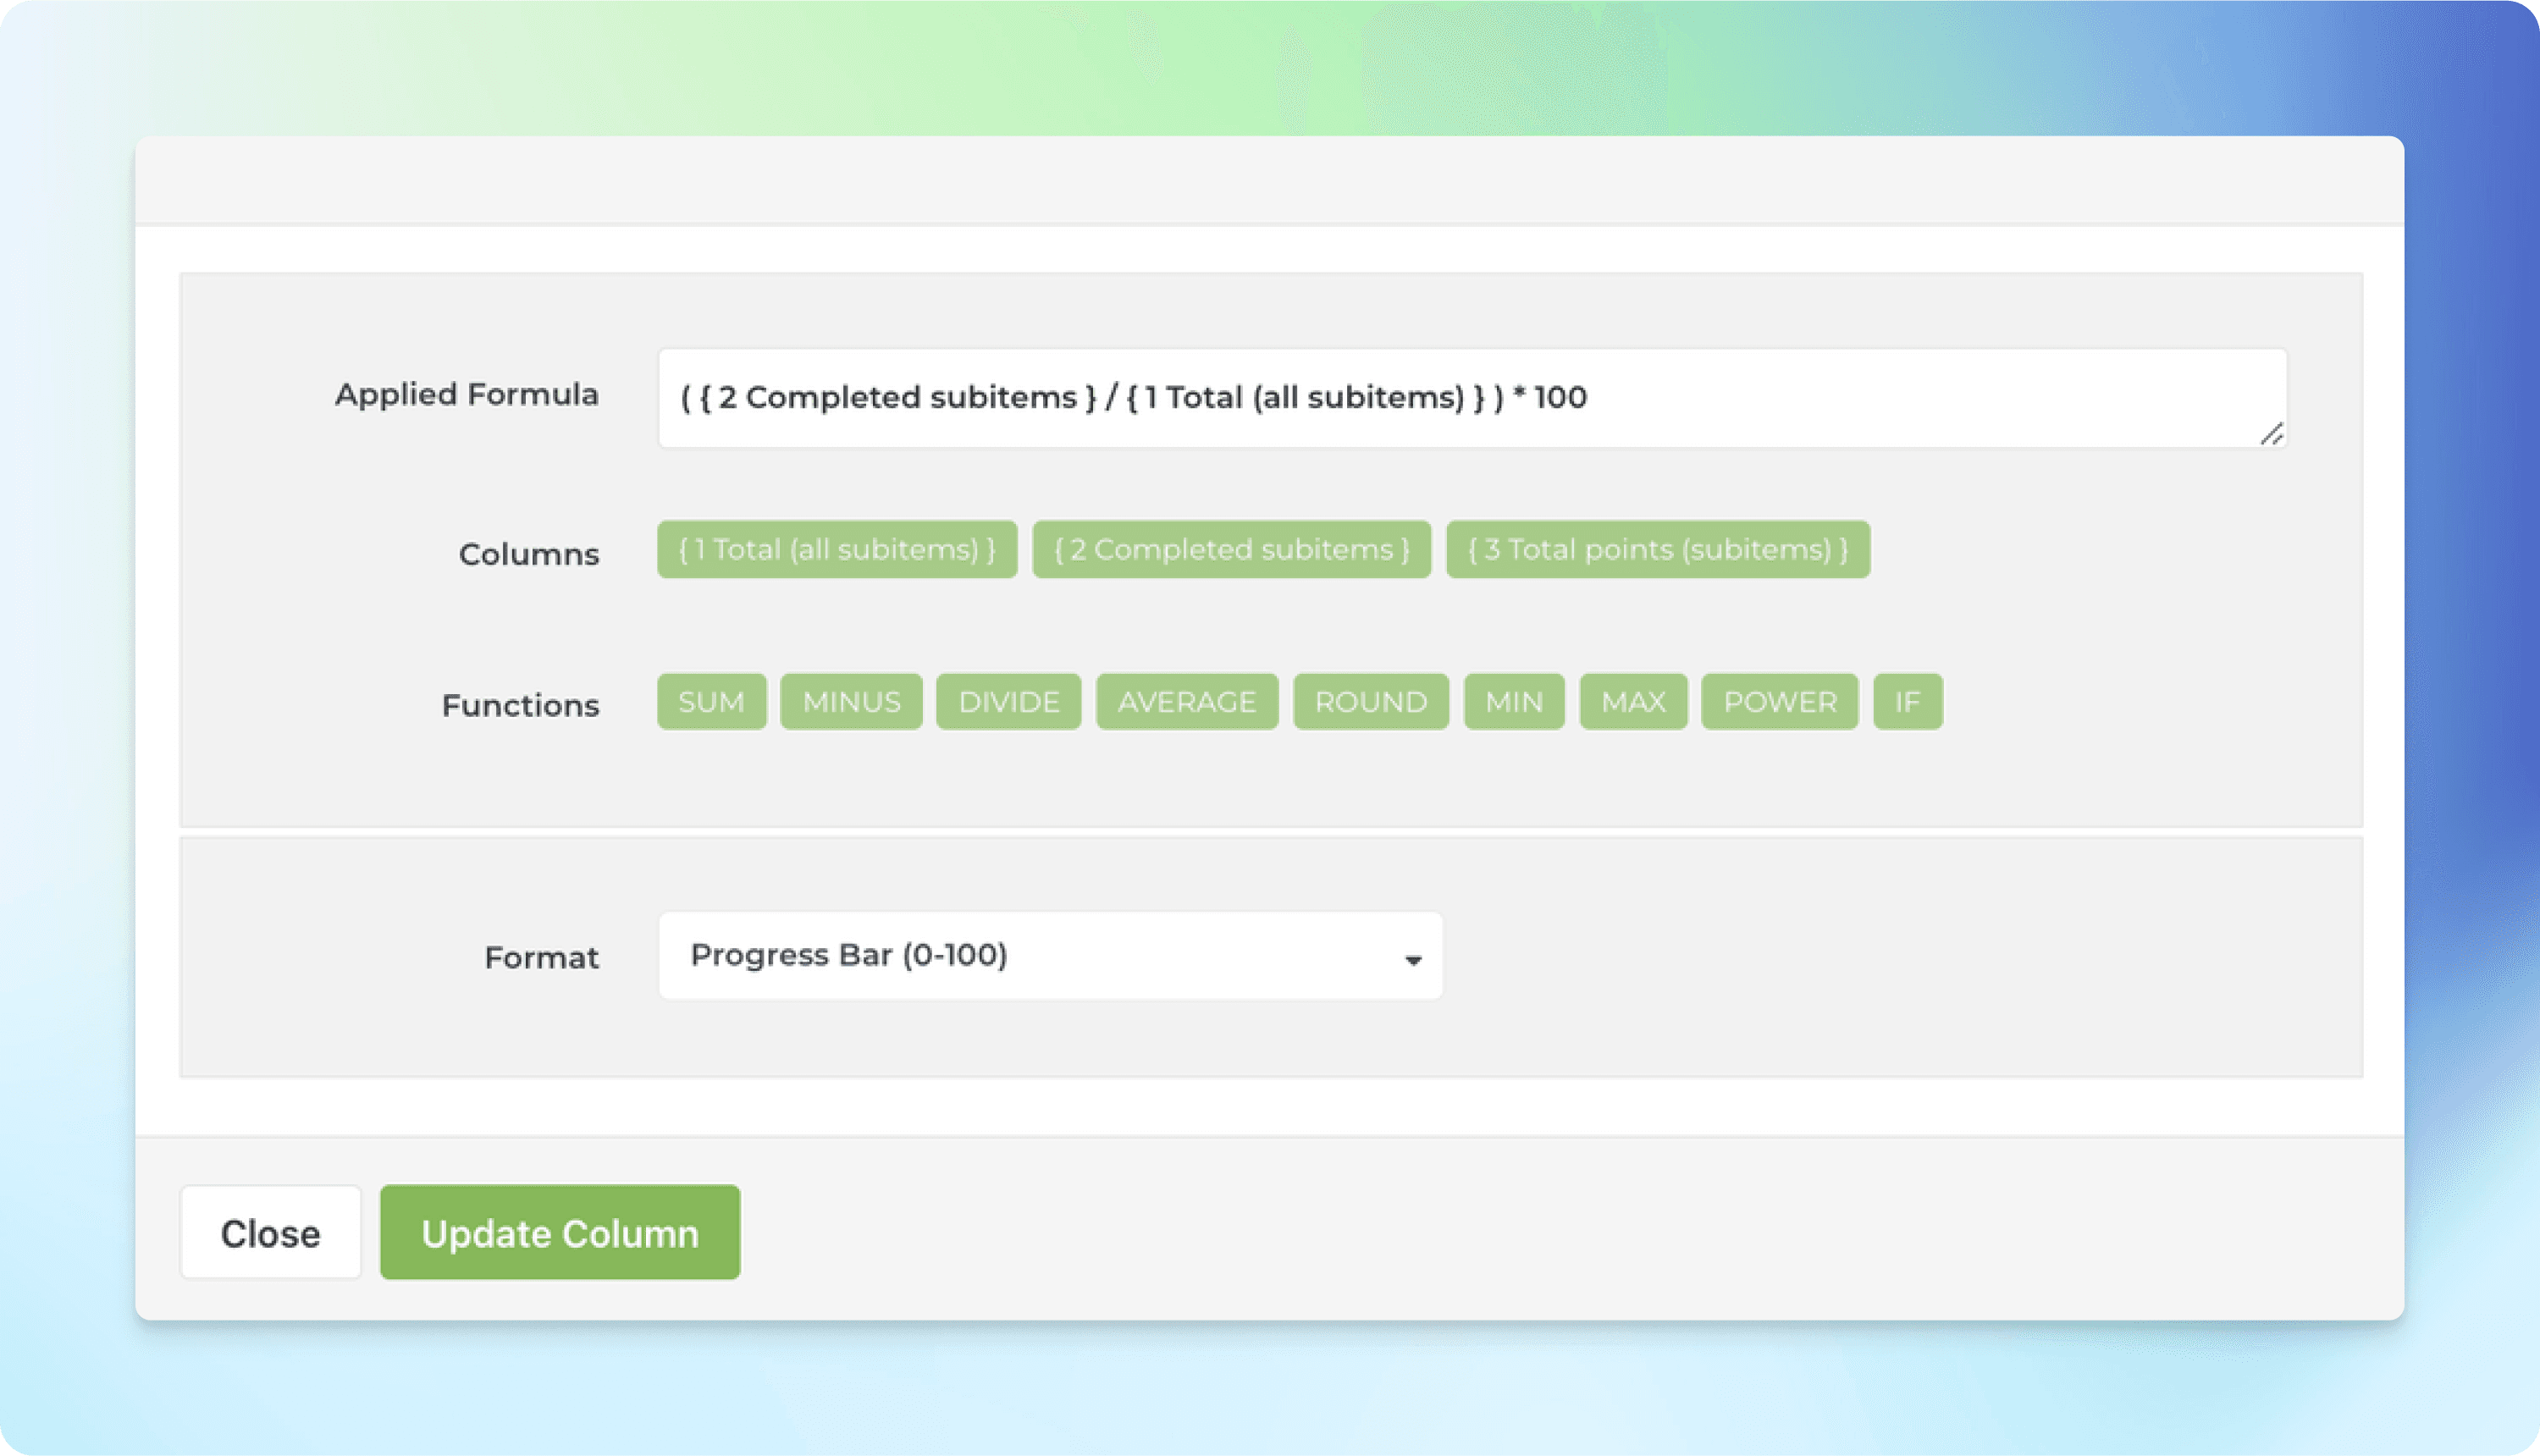
The columns are configurable, so you can roll up any of the available metrics from subitems. The progress bar can be used to show the completion percentage of the subitems. It can be added to the chart by applying a formula:
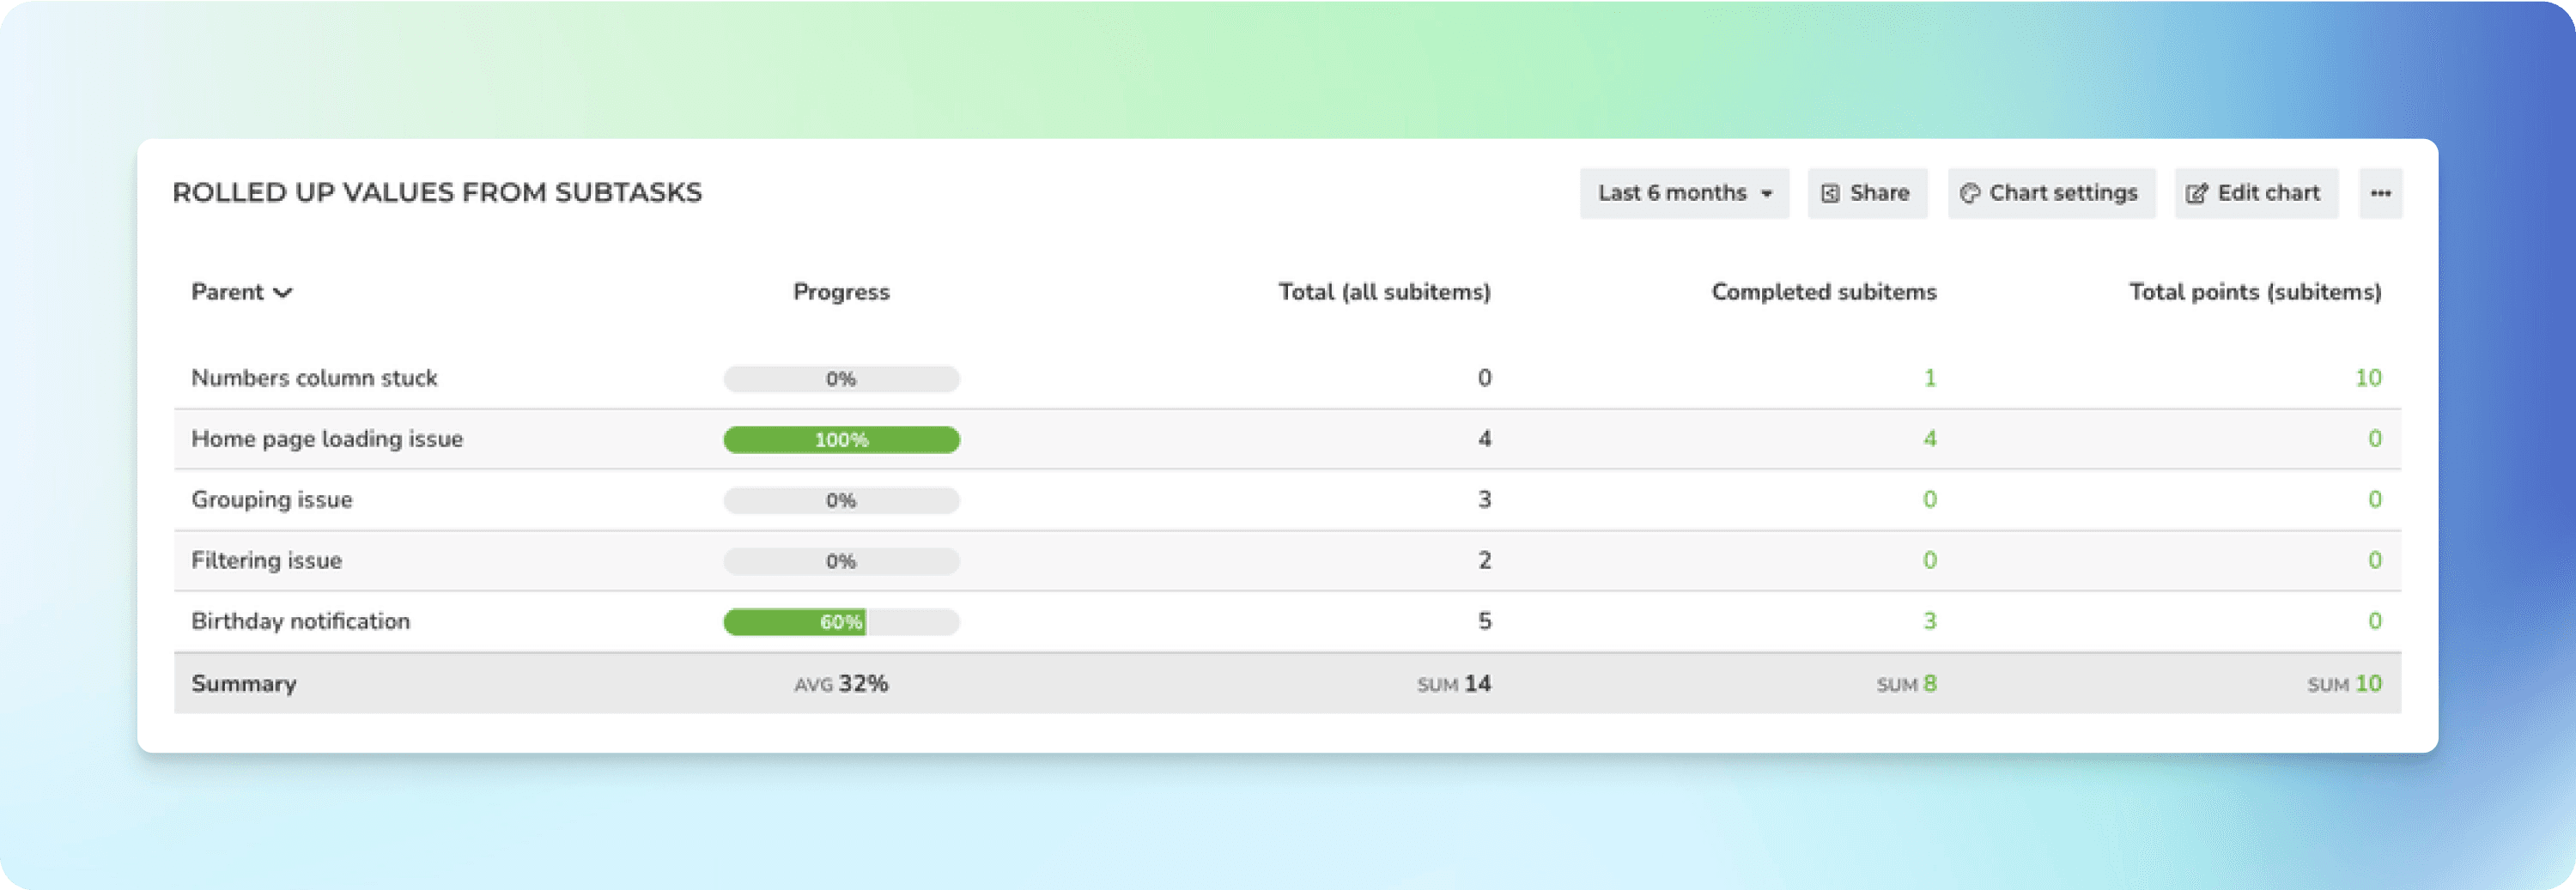
Here’s the final chart:
Filtering by subtasks
In the chart settings, you can include or exclude subtasks using the Item type filter:
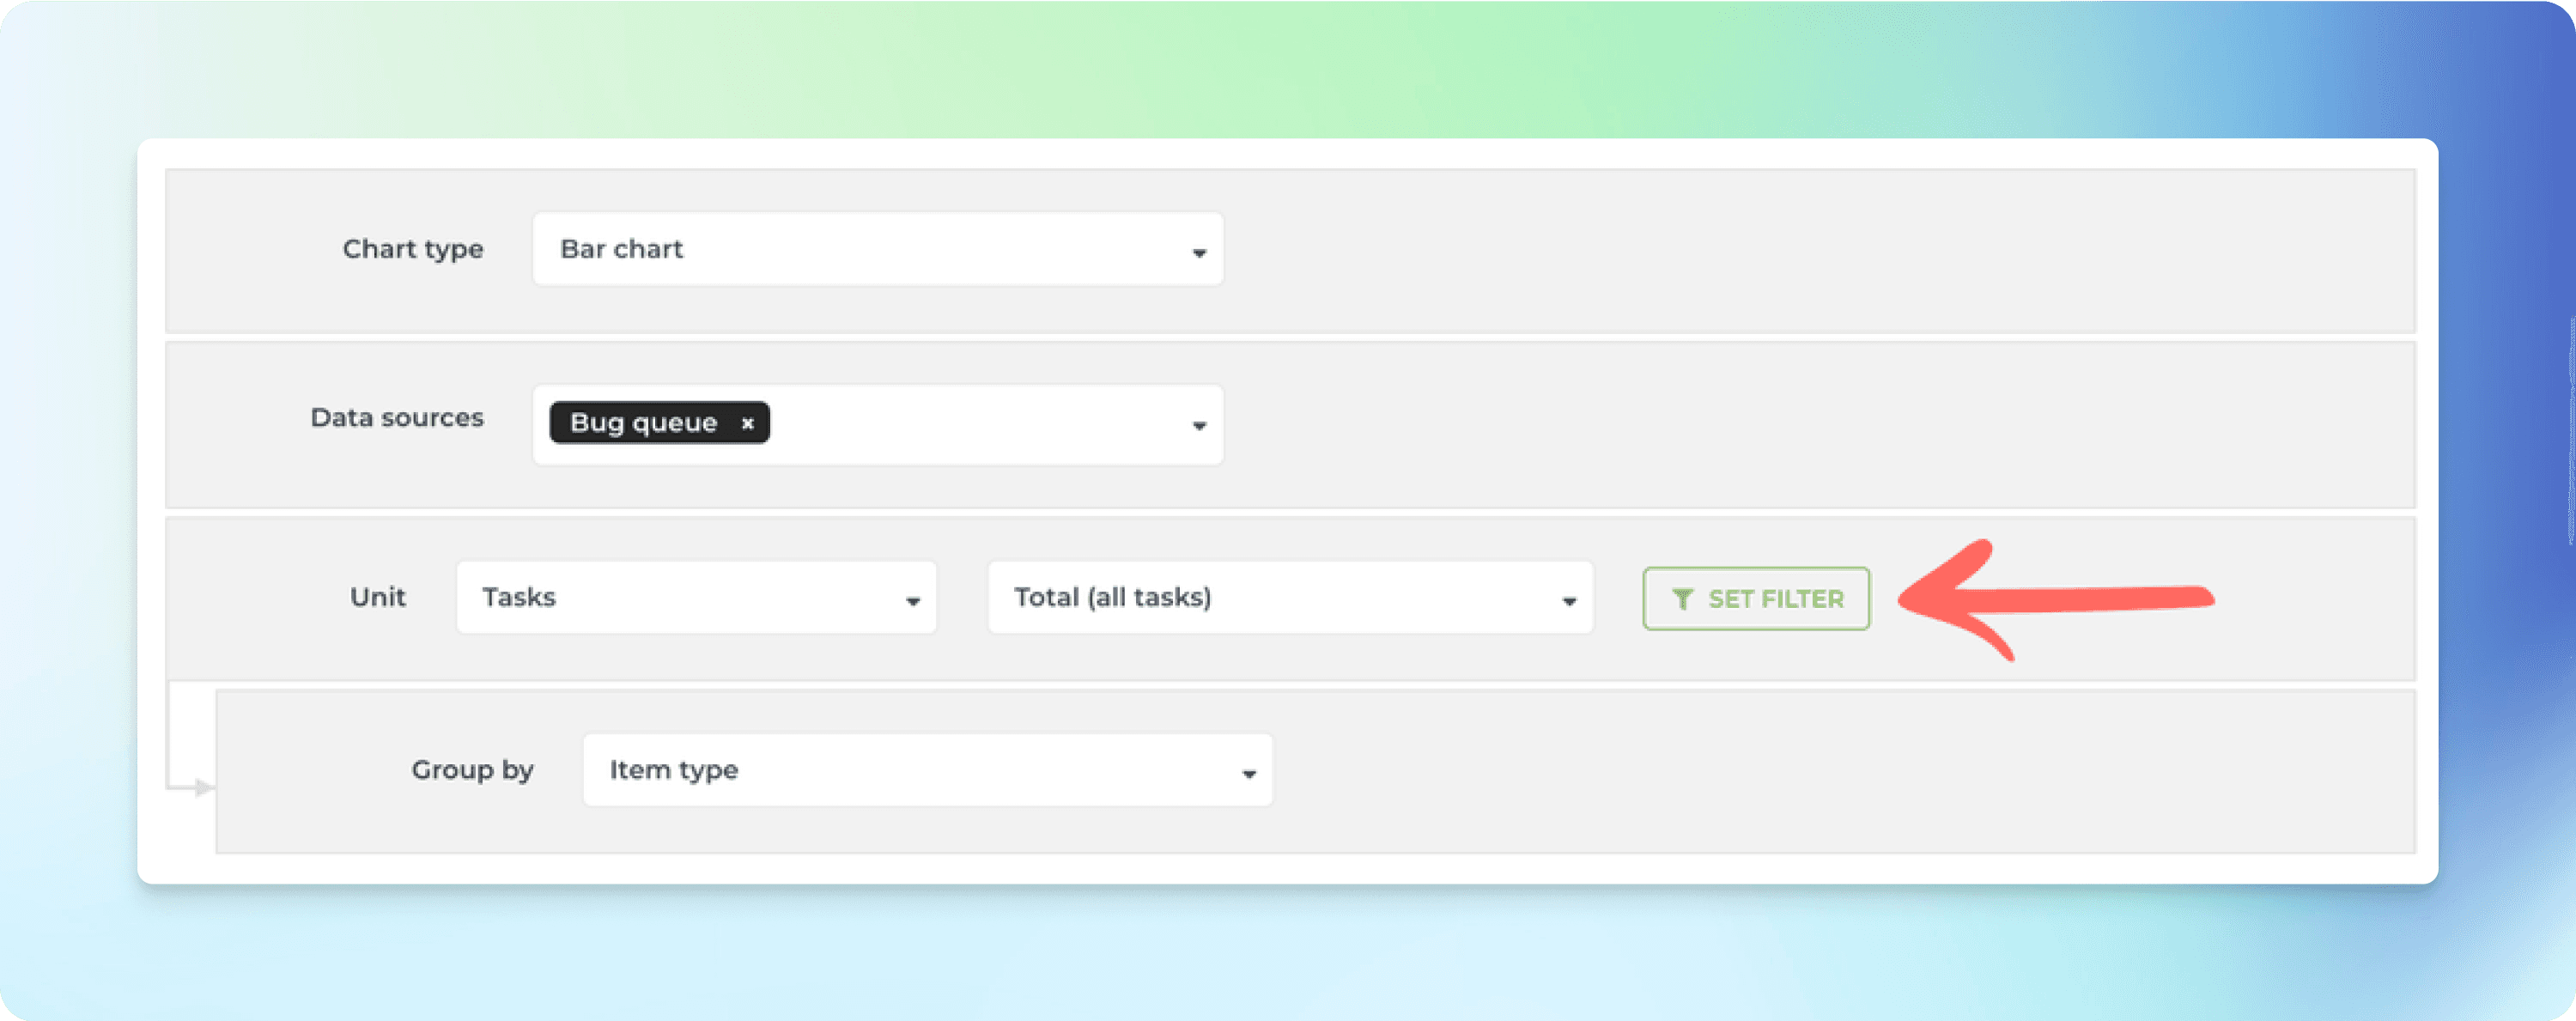
Click the Set filter button to open the filter modal
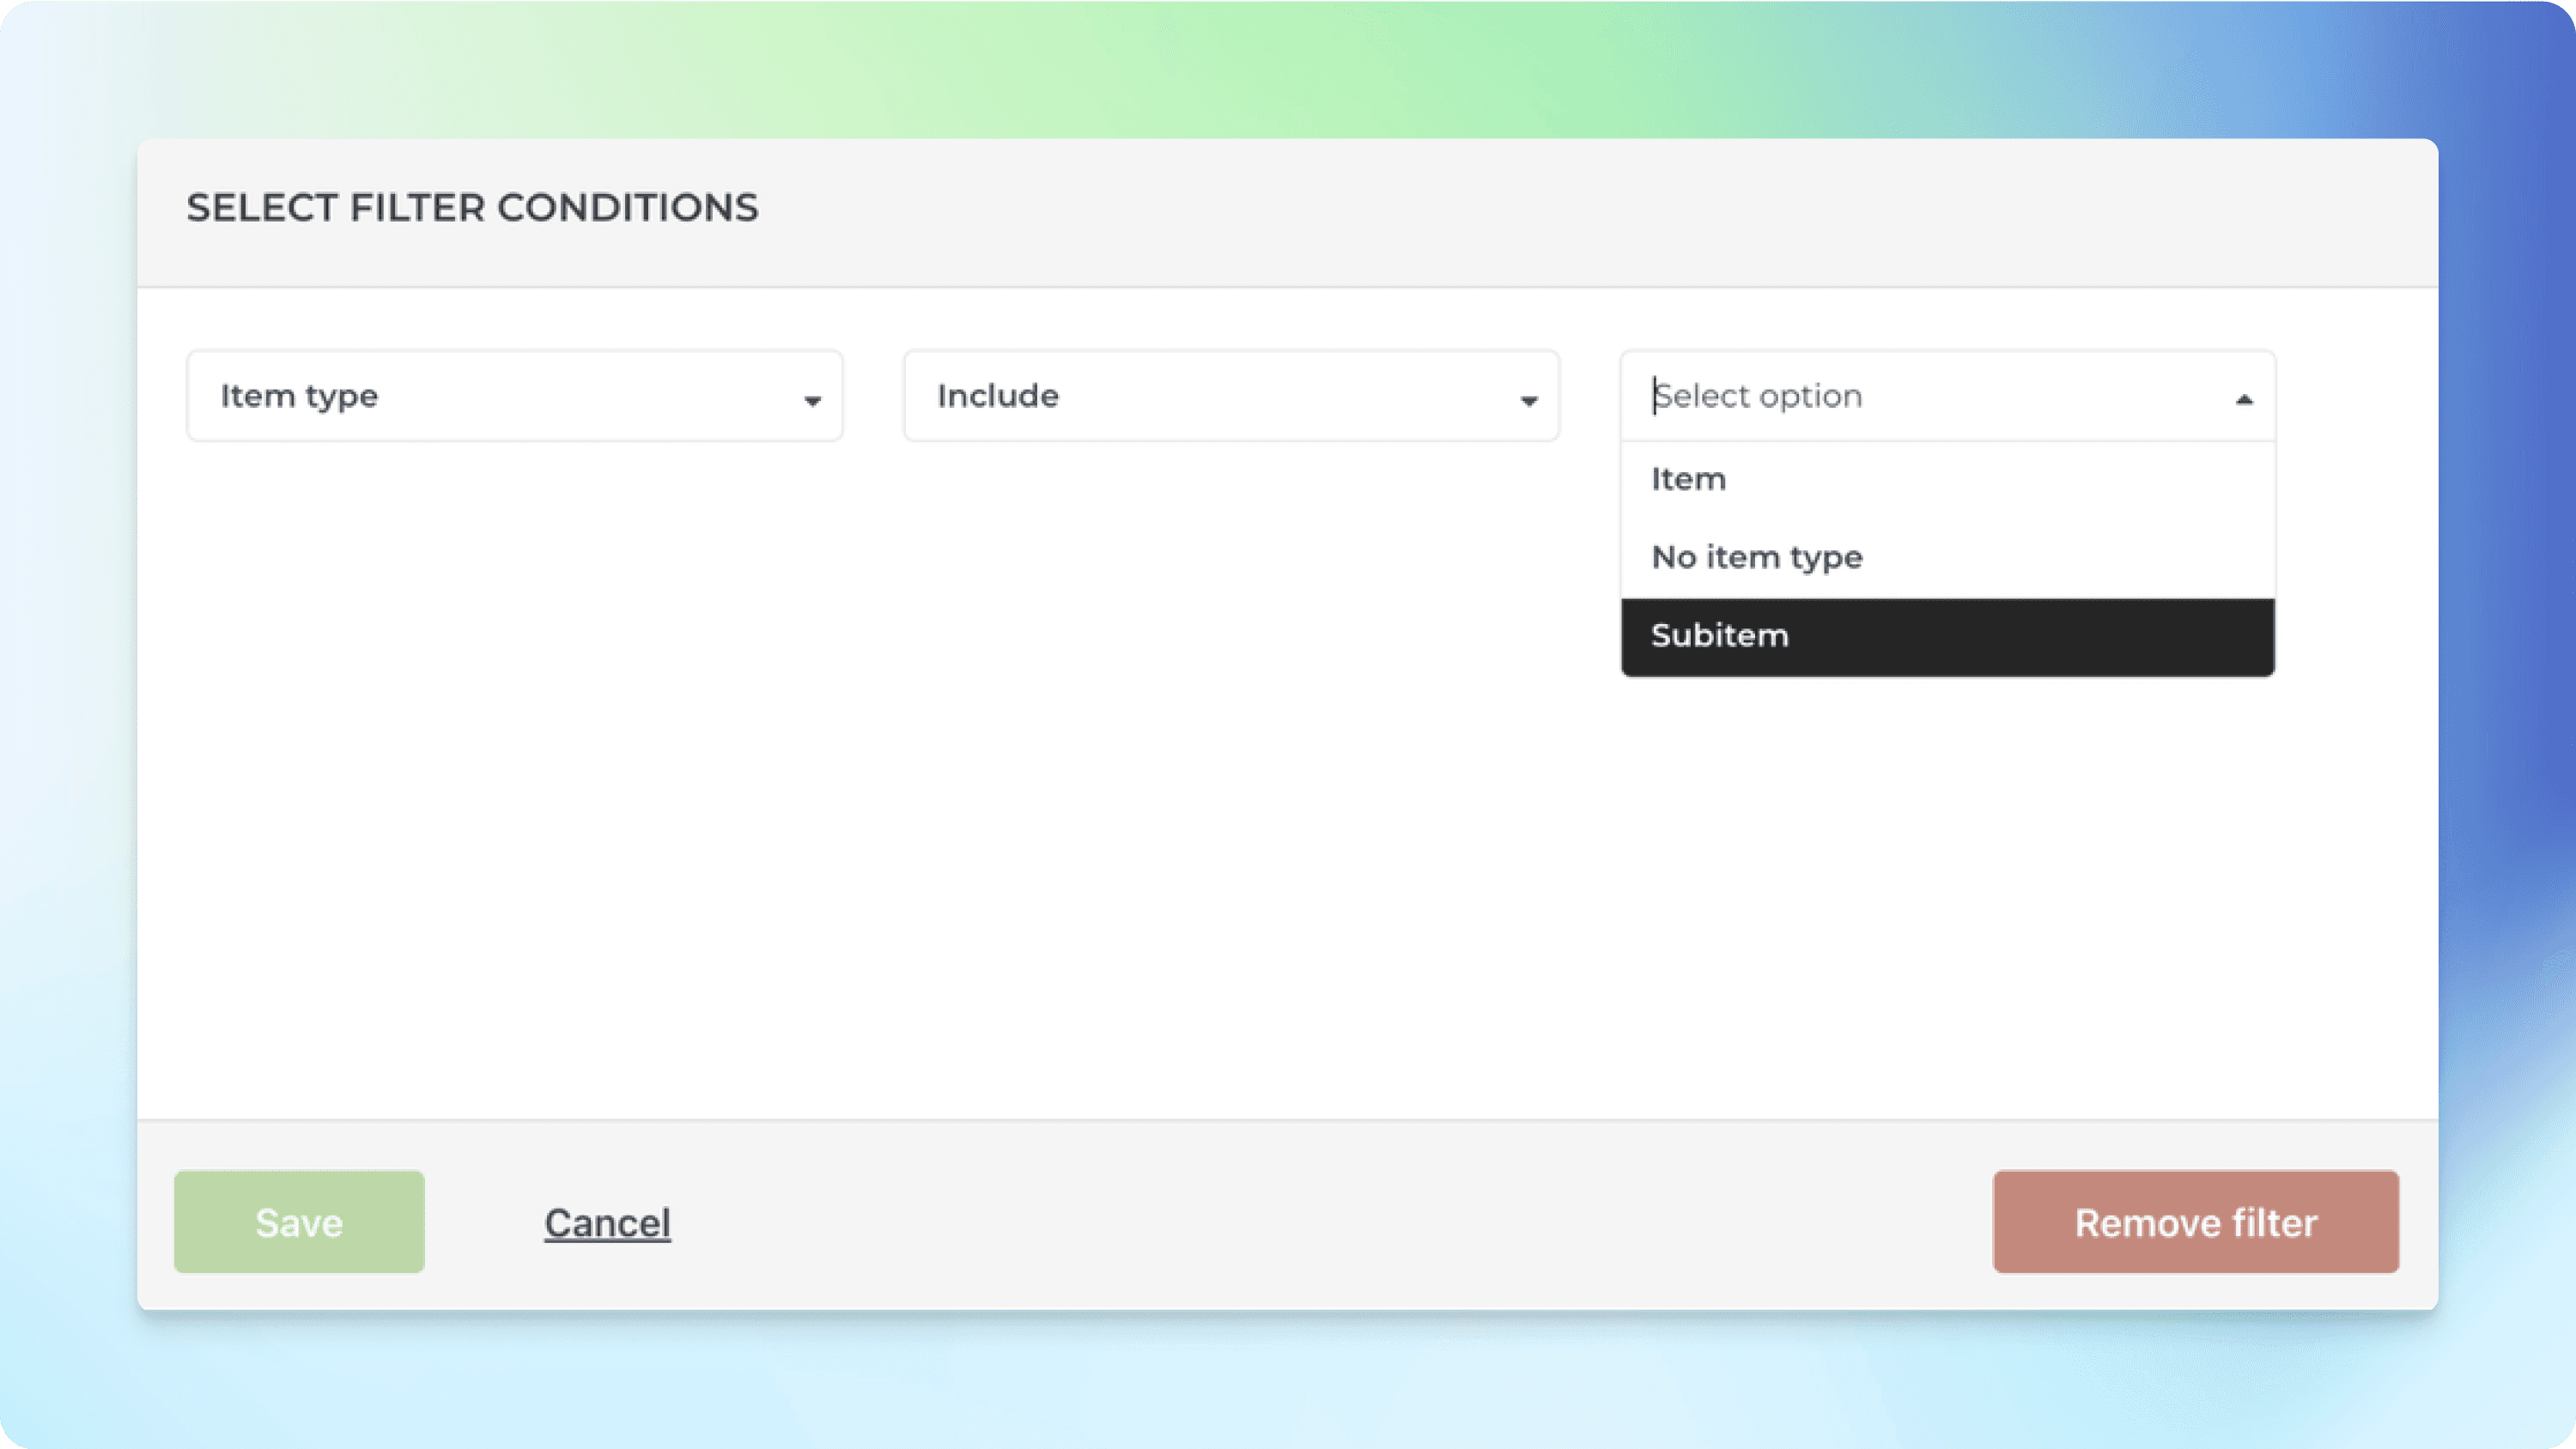
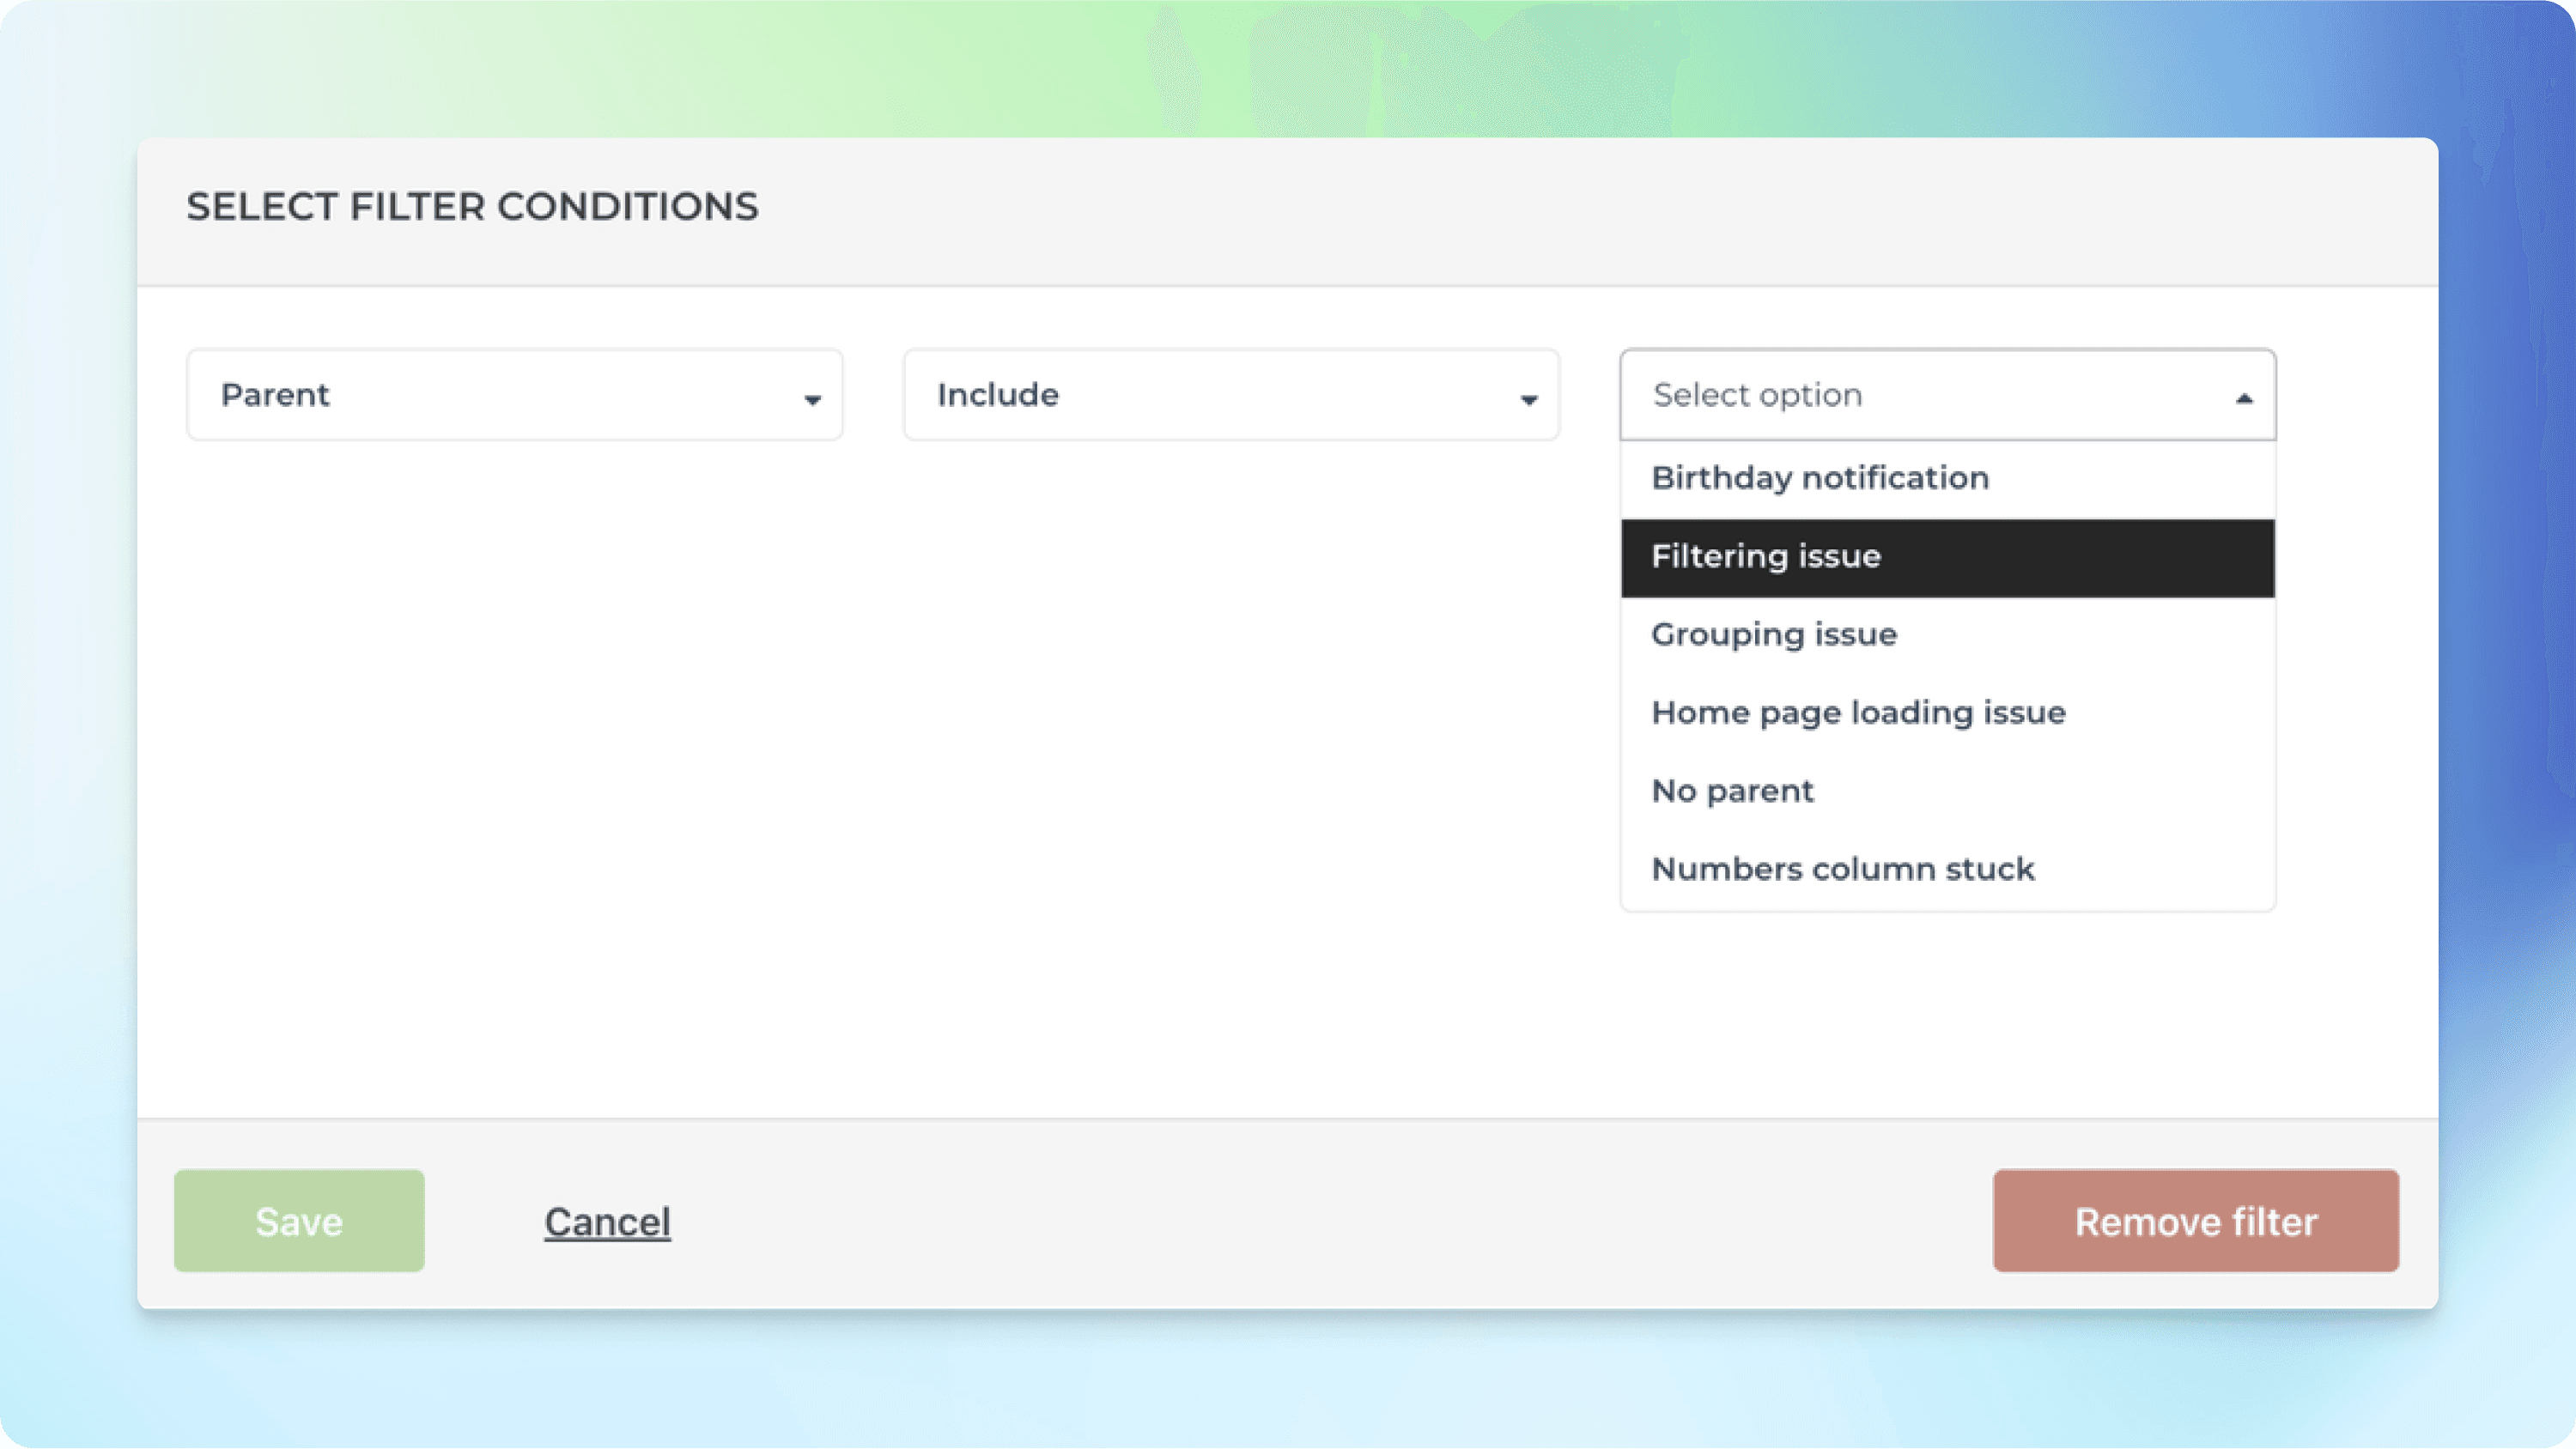
Select Item or Subitem as the filter criteria.. You can also filter by the parent (task that has subtasks).
The new subtasks support is now available for all Asana, monday.com, and Jira users. Notice that you may have to re-import the data sources to enable subtasks.
Let us know if you have questions or feedback by contacting hello@screenful.com. To stay on the loop, read our blog, or follow us on LinkedIn.