How to create charts using custom date fields
How to create charts using custom date fields
You can track work based on any date fields, such as start date or due date, or by any of your custom date fields. When creating a custom chart, you can pick any of your custom date fields as the primary filter for your chart. You can further tune the chart by setting additional filters.
You can track work based on any date fields, such as start date or due date, or by any of your custom date fields. When creating a custom chart, you can pick any of your custom date fields as the primary filter for your chart. You can further tune the chart by setting additional filters.
You can track work based on any date fields, such as start date or due date, or by any of your custom date fields. When creating a custom chart, you can pick any of your custom date fields as the primary filter for your chart. You can further tune the chart by setting additional filters.
Tracking velocity based on a custom date field
All your custom date fields are selectable in the chart editor. Let's assume you have a custom date field, Completion date, on your board. You can create a chart that shows how many items have been completed in the past by selecting By Completion date as the metric for the chart.
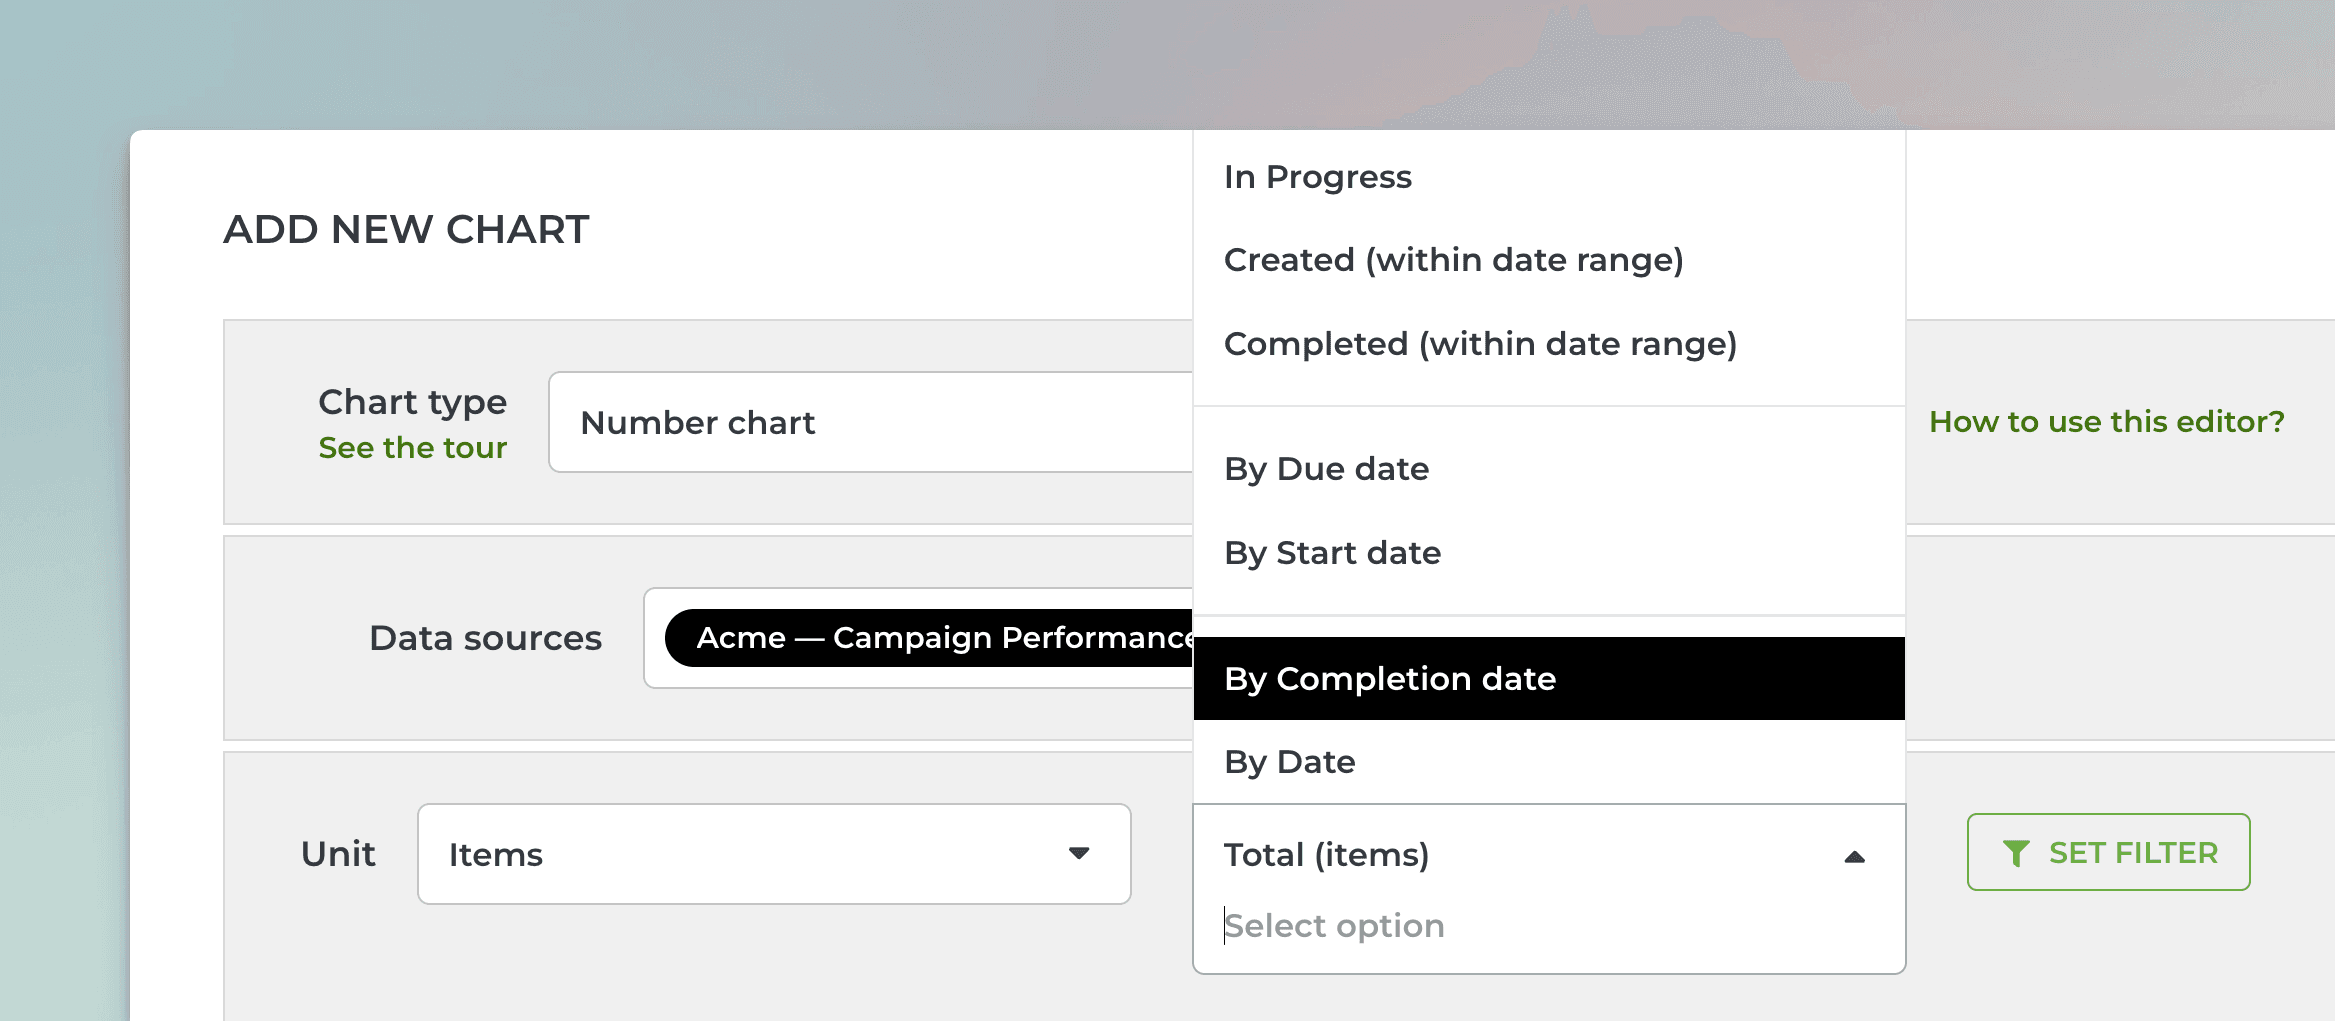
That will work the same way as if you had selected Completed (within date range), except that it will only look at the value in the date field. If the date is in the past, it is considered completed, regardless of the workflow state of that item. You can use it to track the number of items completed based on the selected date field
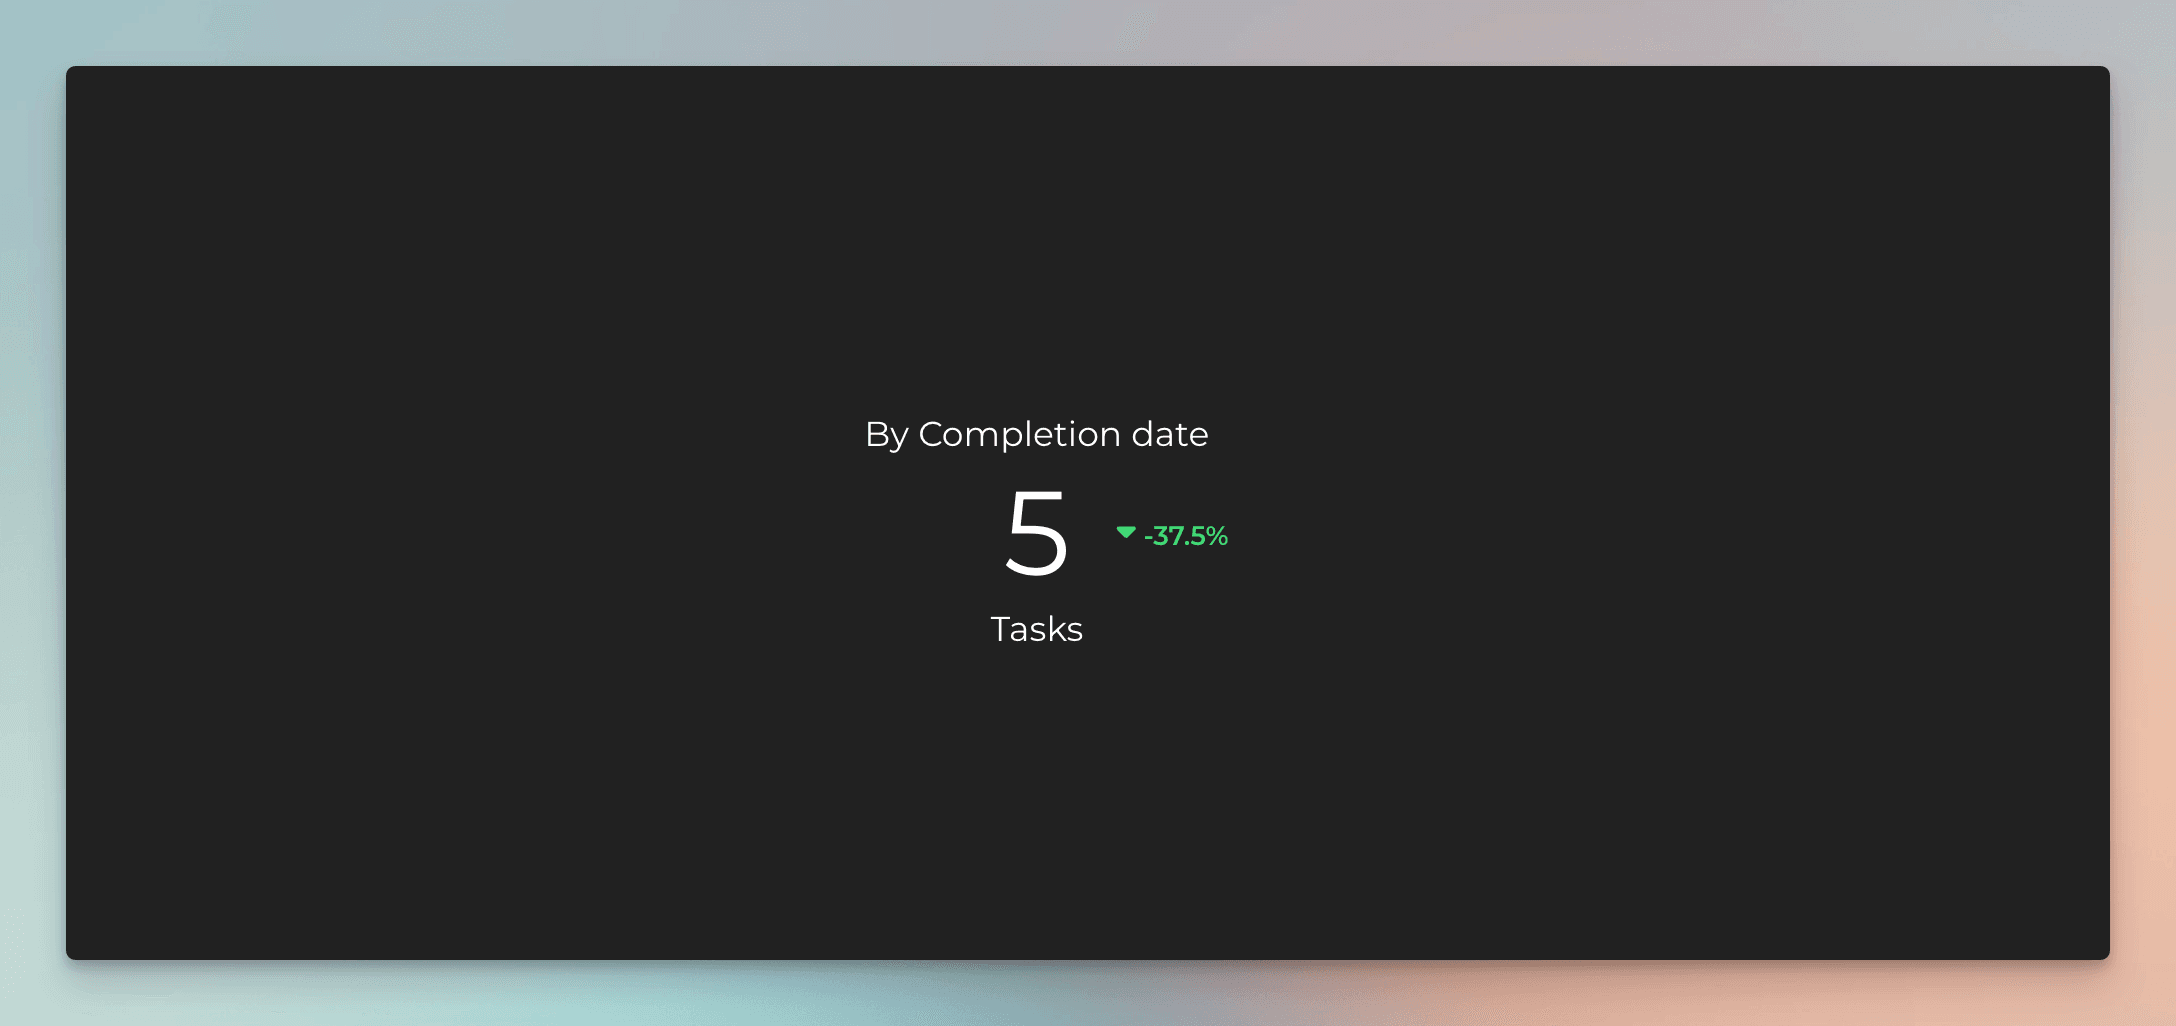
Here's the resulting chart:
You can click through the chart to see the items behind the number:
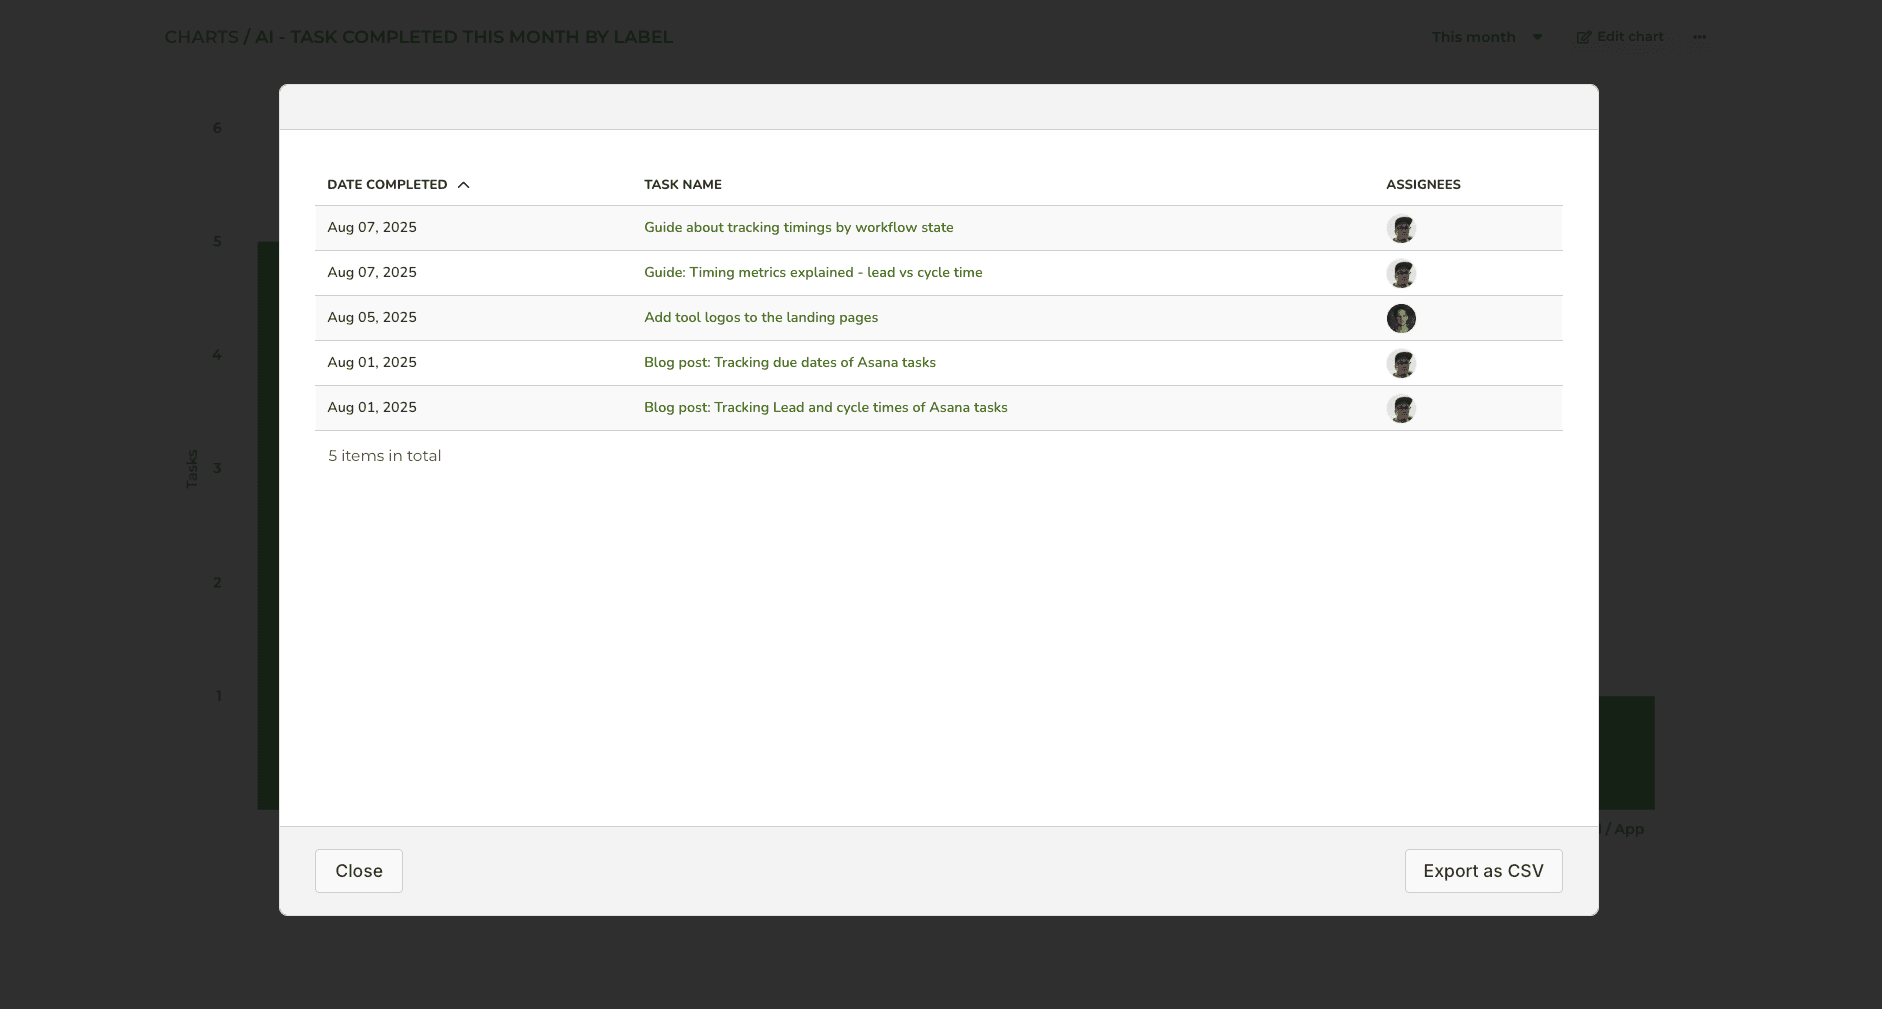
You can export the list by clicking the Export as CSV button.
While this example was using the Number chart, you have the same options available with any chart type.
Tracking velocity based on a custom date field
All your custom date fields are selectable in the chart editor. Let's assume you have a custom date field, Completion date, on your board. You can create a chart that shows how many items have been completed in the past by selecting By Completion date as the metric for the chart.
That will work the same way as if you had selected Completed (within date range), except that it will only look at the value in the date field. If the date is in the past, it is considered completed, regardless of the workflow state of that item. You can use it to track the number of items completed based on the selected date field
Here's the resulting chart:
You can click through the chart to see the items behind the number:
You can export the list by clicking the Export as CSV button.
While this example was using the Number chart, you have the same options available with any chart type.
Tracking due dates
The due date is special in that you can use predefined filters, such as overdue, completed on time, and completed overdue. They can refer to the built-in due date field, but you can map any of your custom date fields as a due date. Once mapped, selecting due date from the menu will use the values in your custom date field.
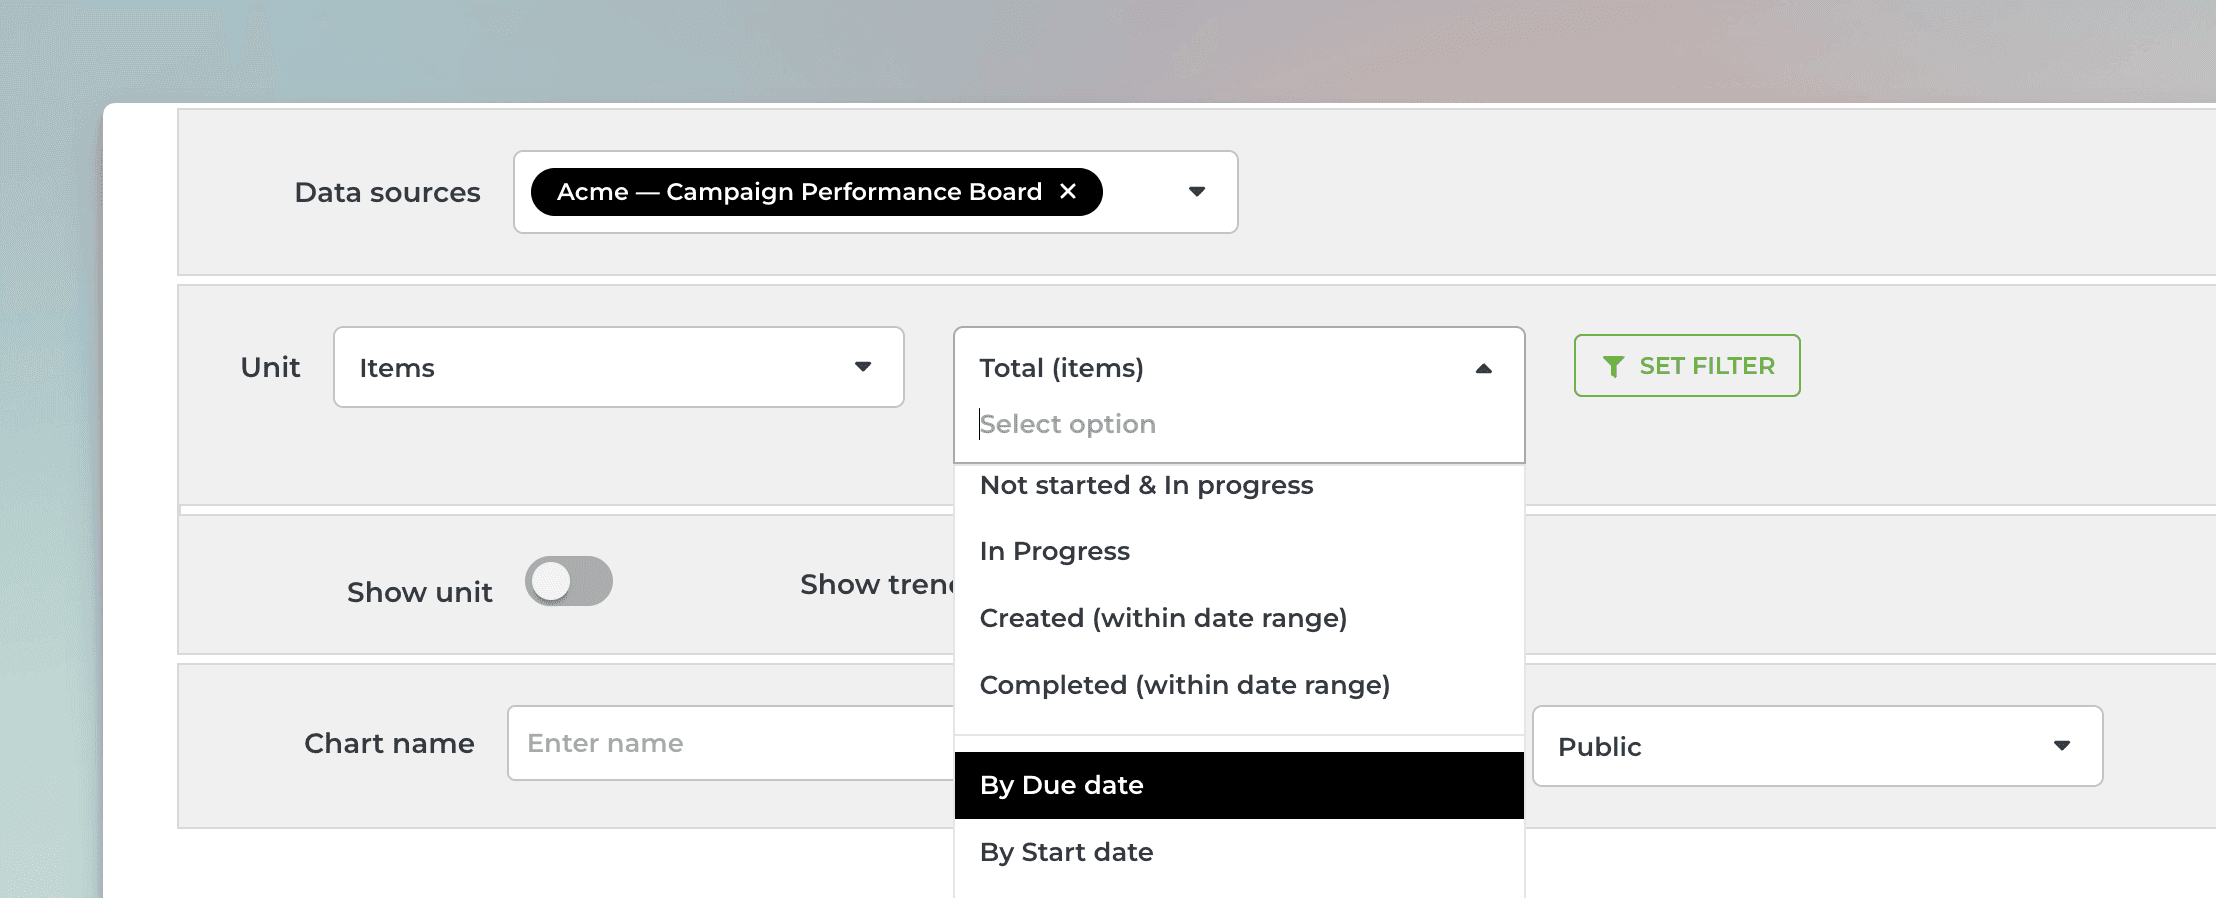
Here's an example configuration using the Task list chart:
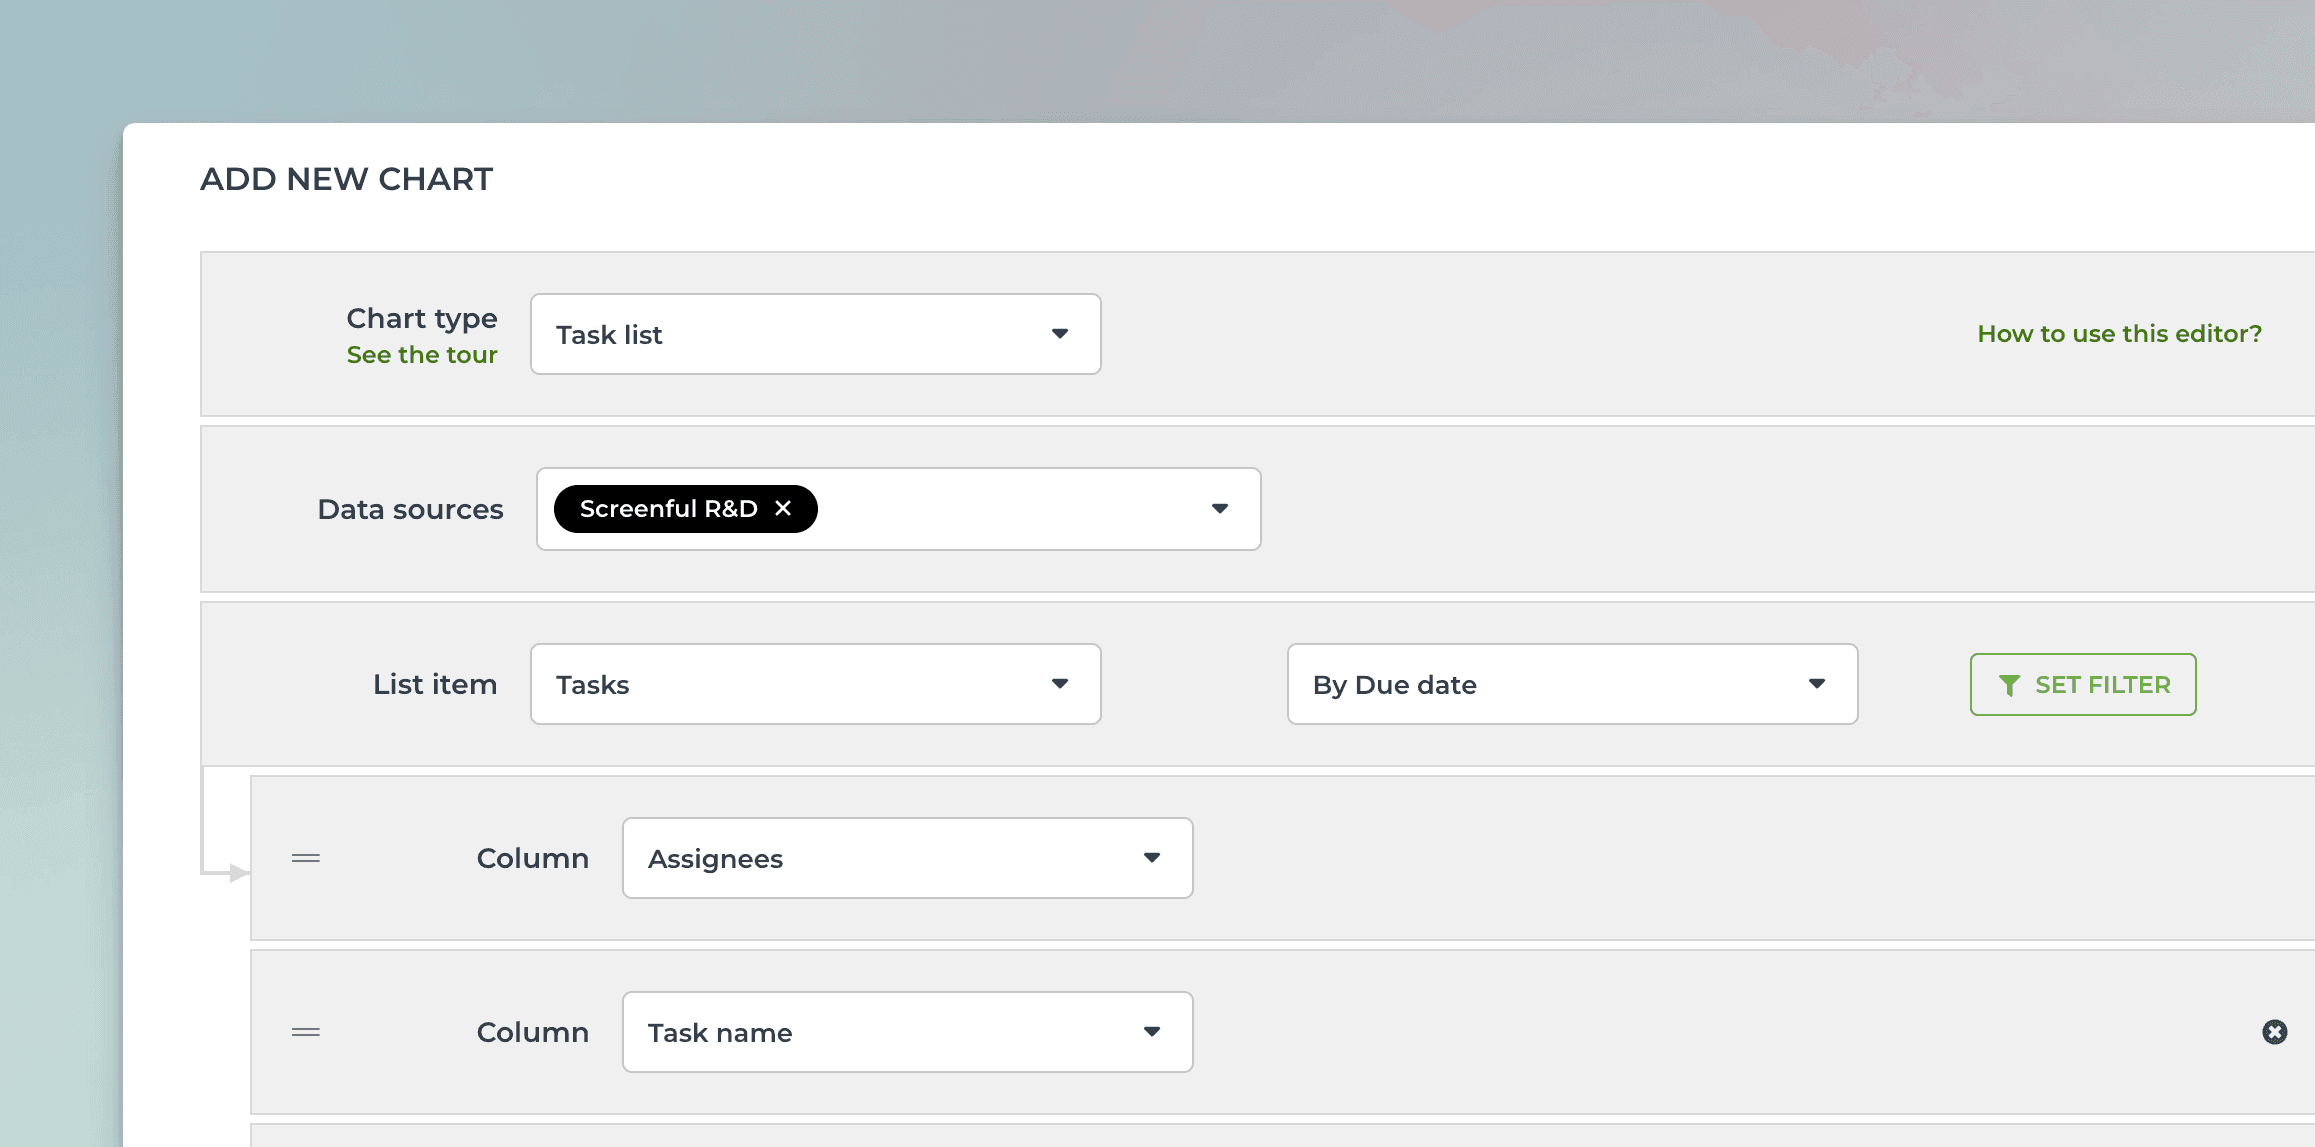
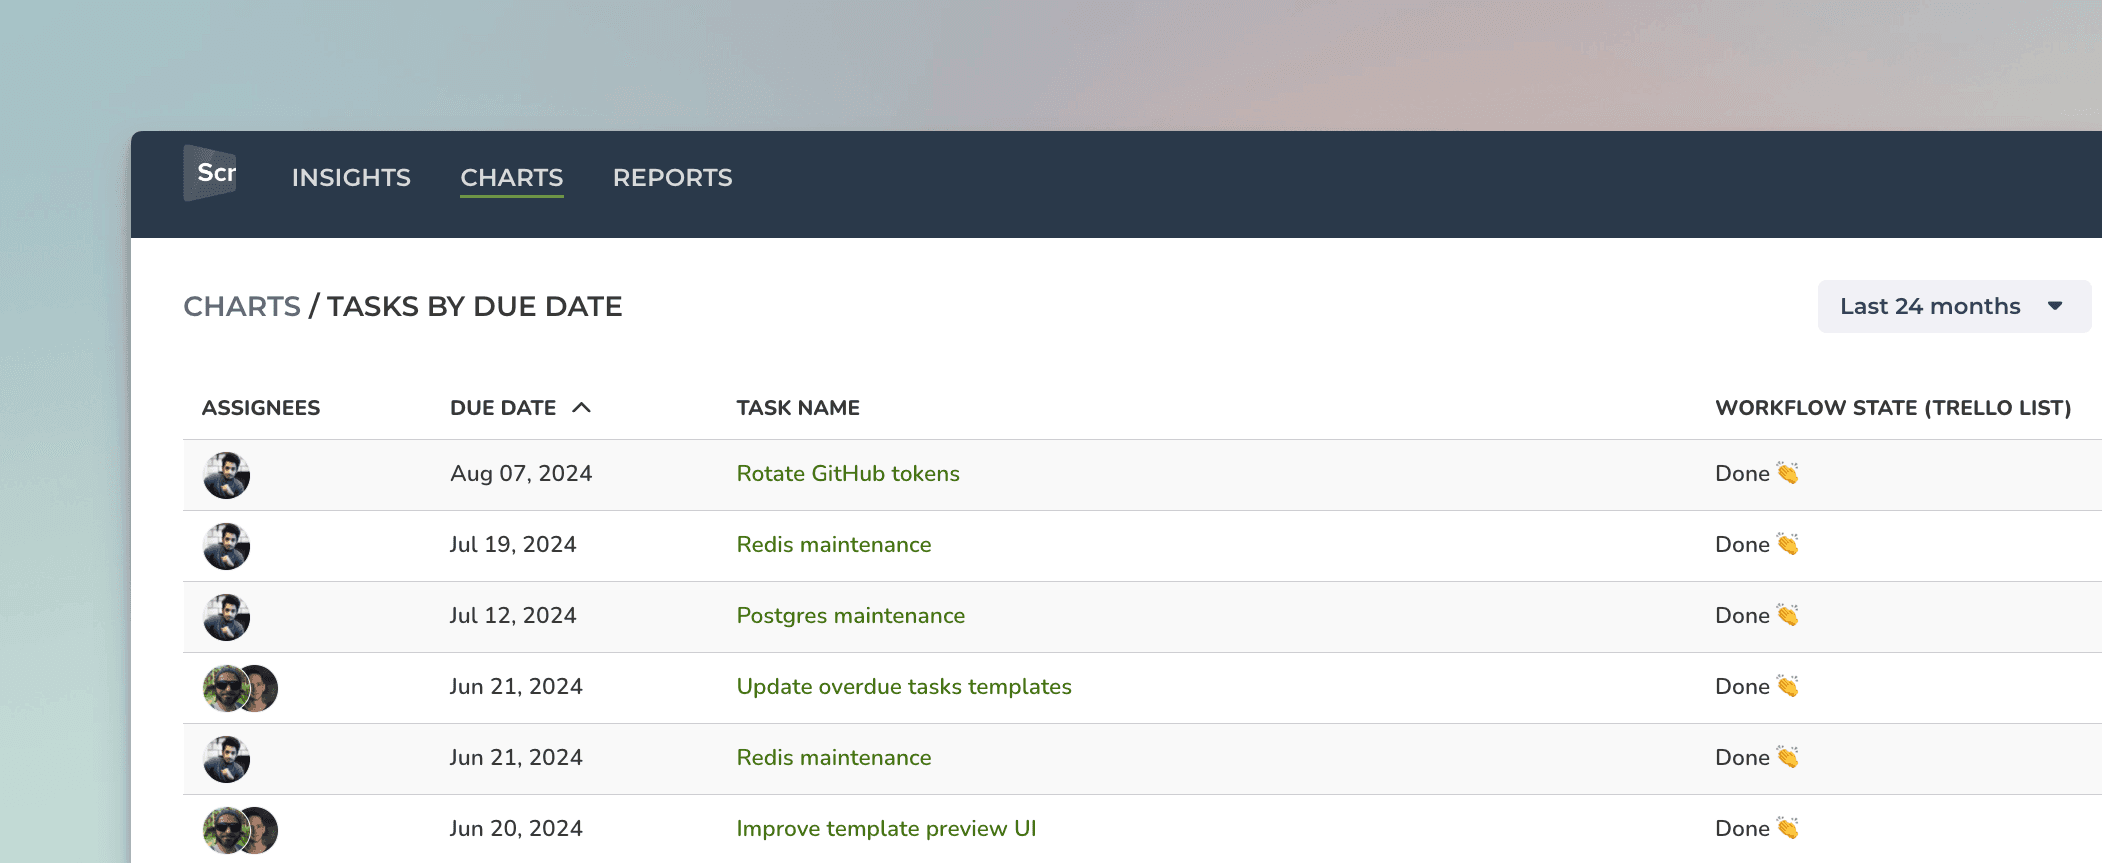
When you pick By Due date from the menu, the resulting task list contains items that have due date within the selected date range:
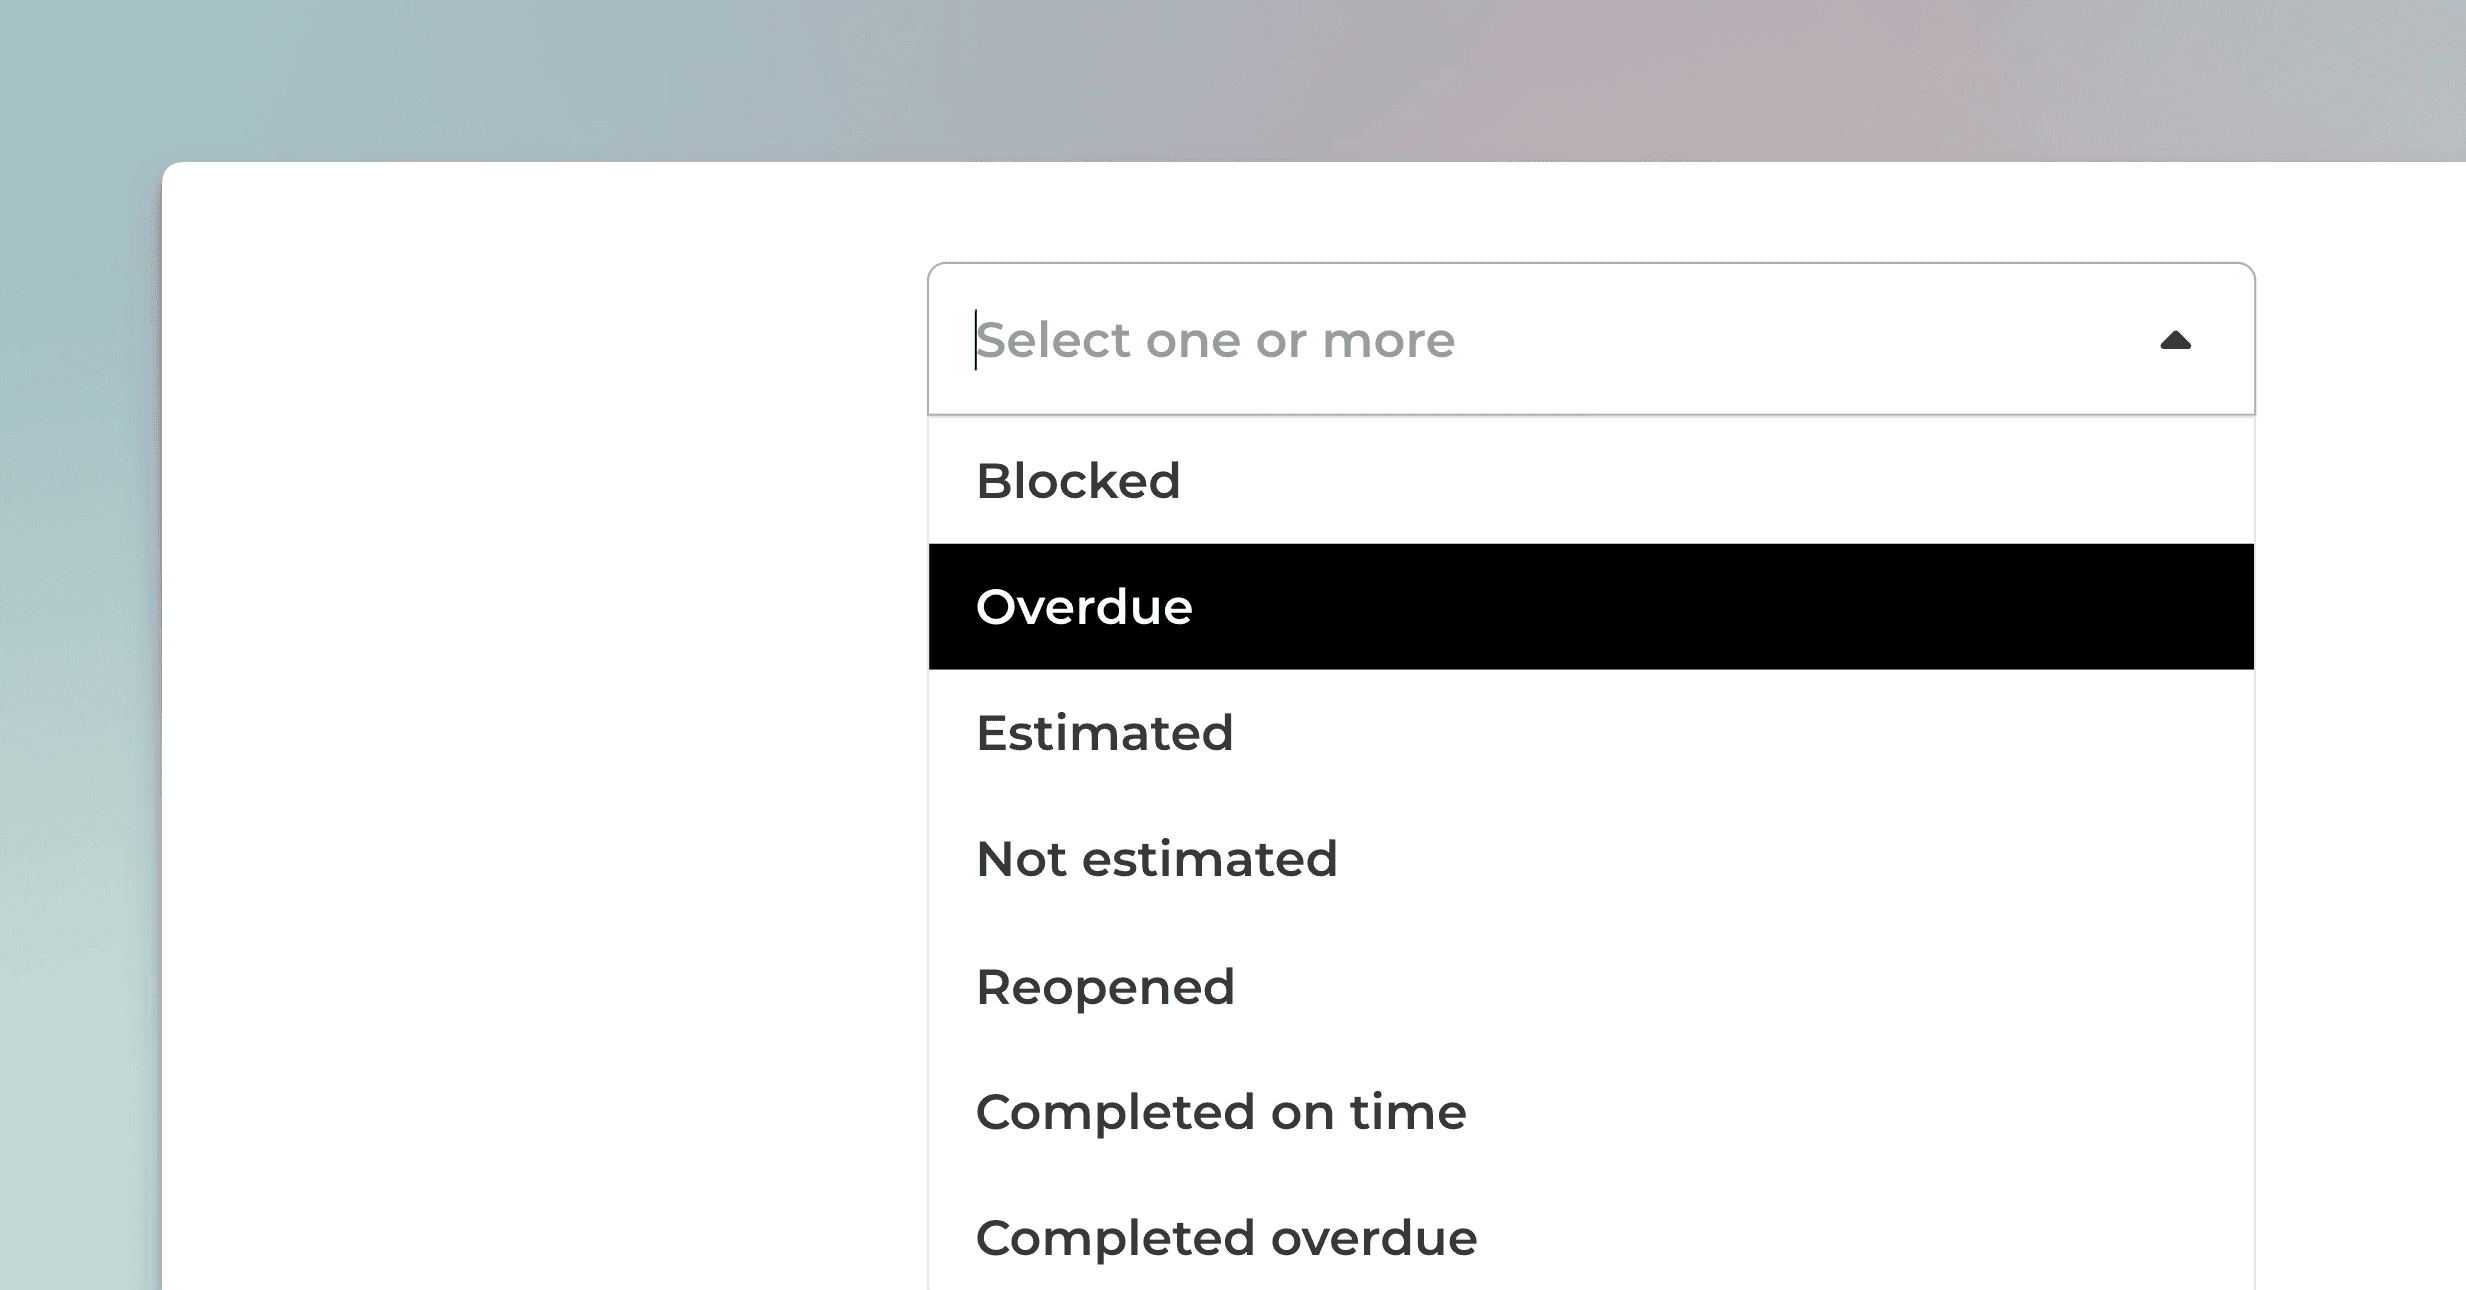
With the Status filter, you can filter the chart by overdue, completed on time, and completed overdue.
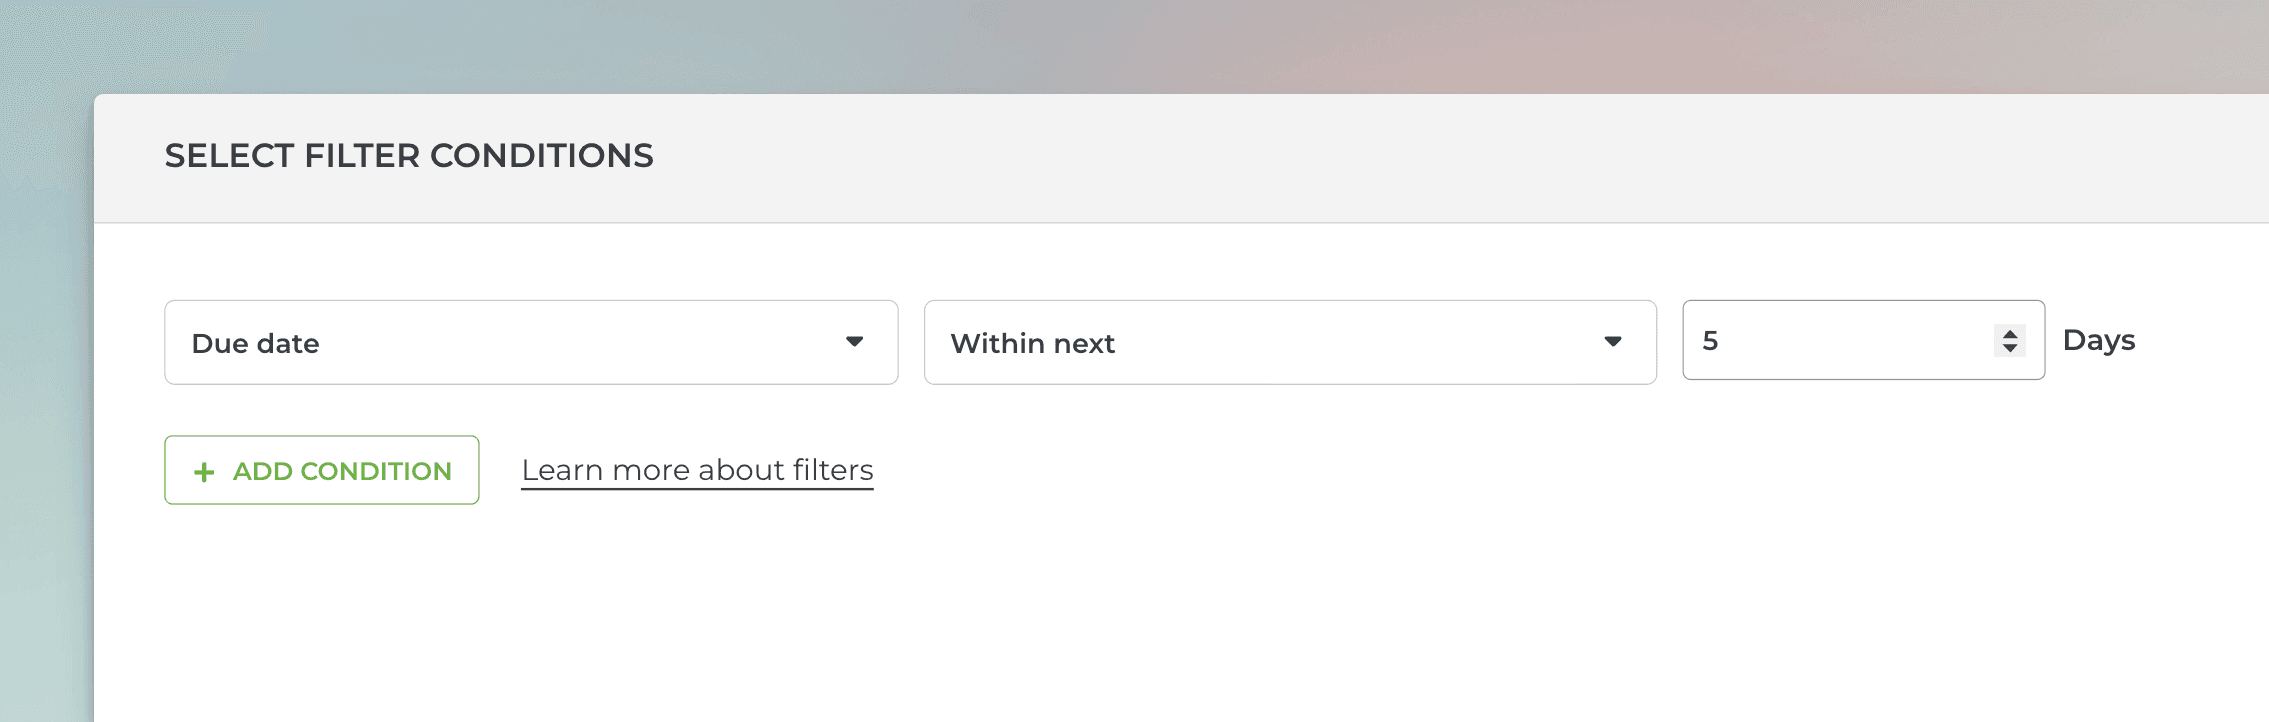
You can also set conditions such as due within 5 days:
Tracking due dates
The due date is special in that you can use predefined filters, such as overdue, completed on time, and completed overdue. They can refer to the built-in due date field, but you can map any of your custom date fields as a due date. Once mapped, selecting due date from the menu will use the values in your custom date field.
Here's an example configuration using the Task list chart:
When you pick By Due date from the menu, the resulting task list contains items that have due date within the selected date range:
With the Status filter, you can filter the chart by overdue, completed on time, and completed overdue.
You can also set conditions such as due within 5 days:
Tracking any number field by date
You can track any custom unit, such as Display impressions, by any date field. All your number fields are selectable in the Unit menu.
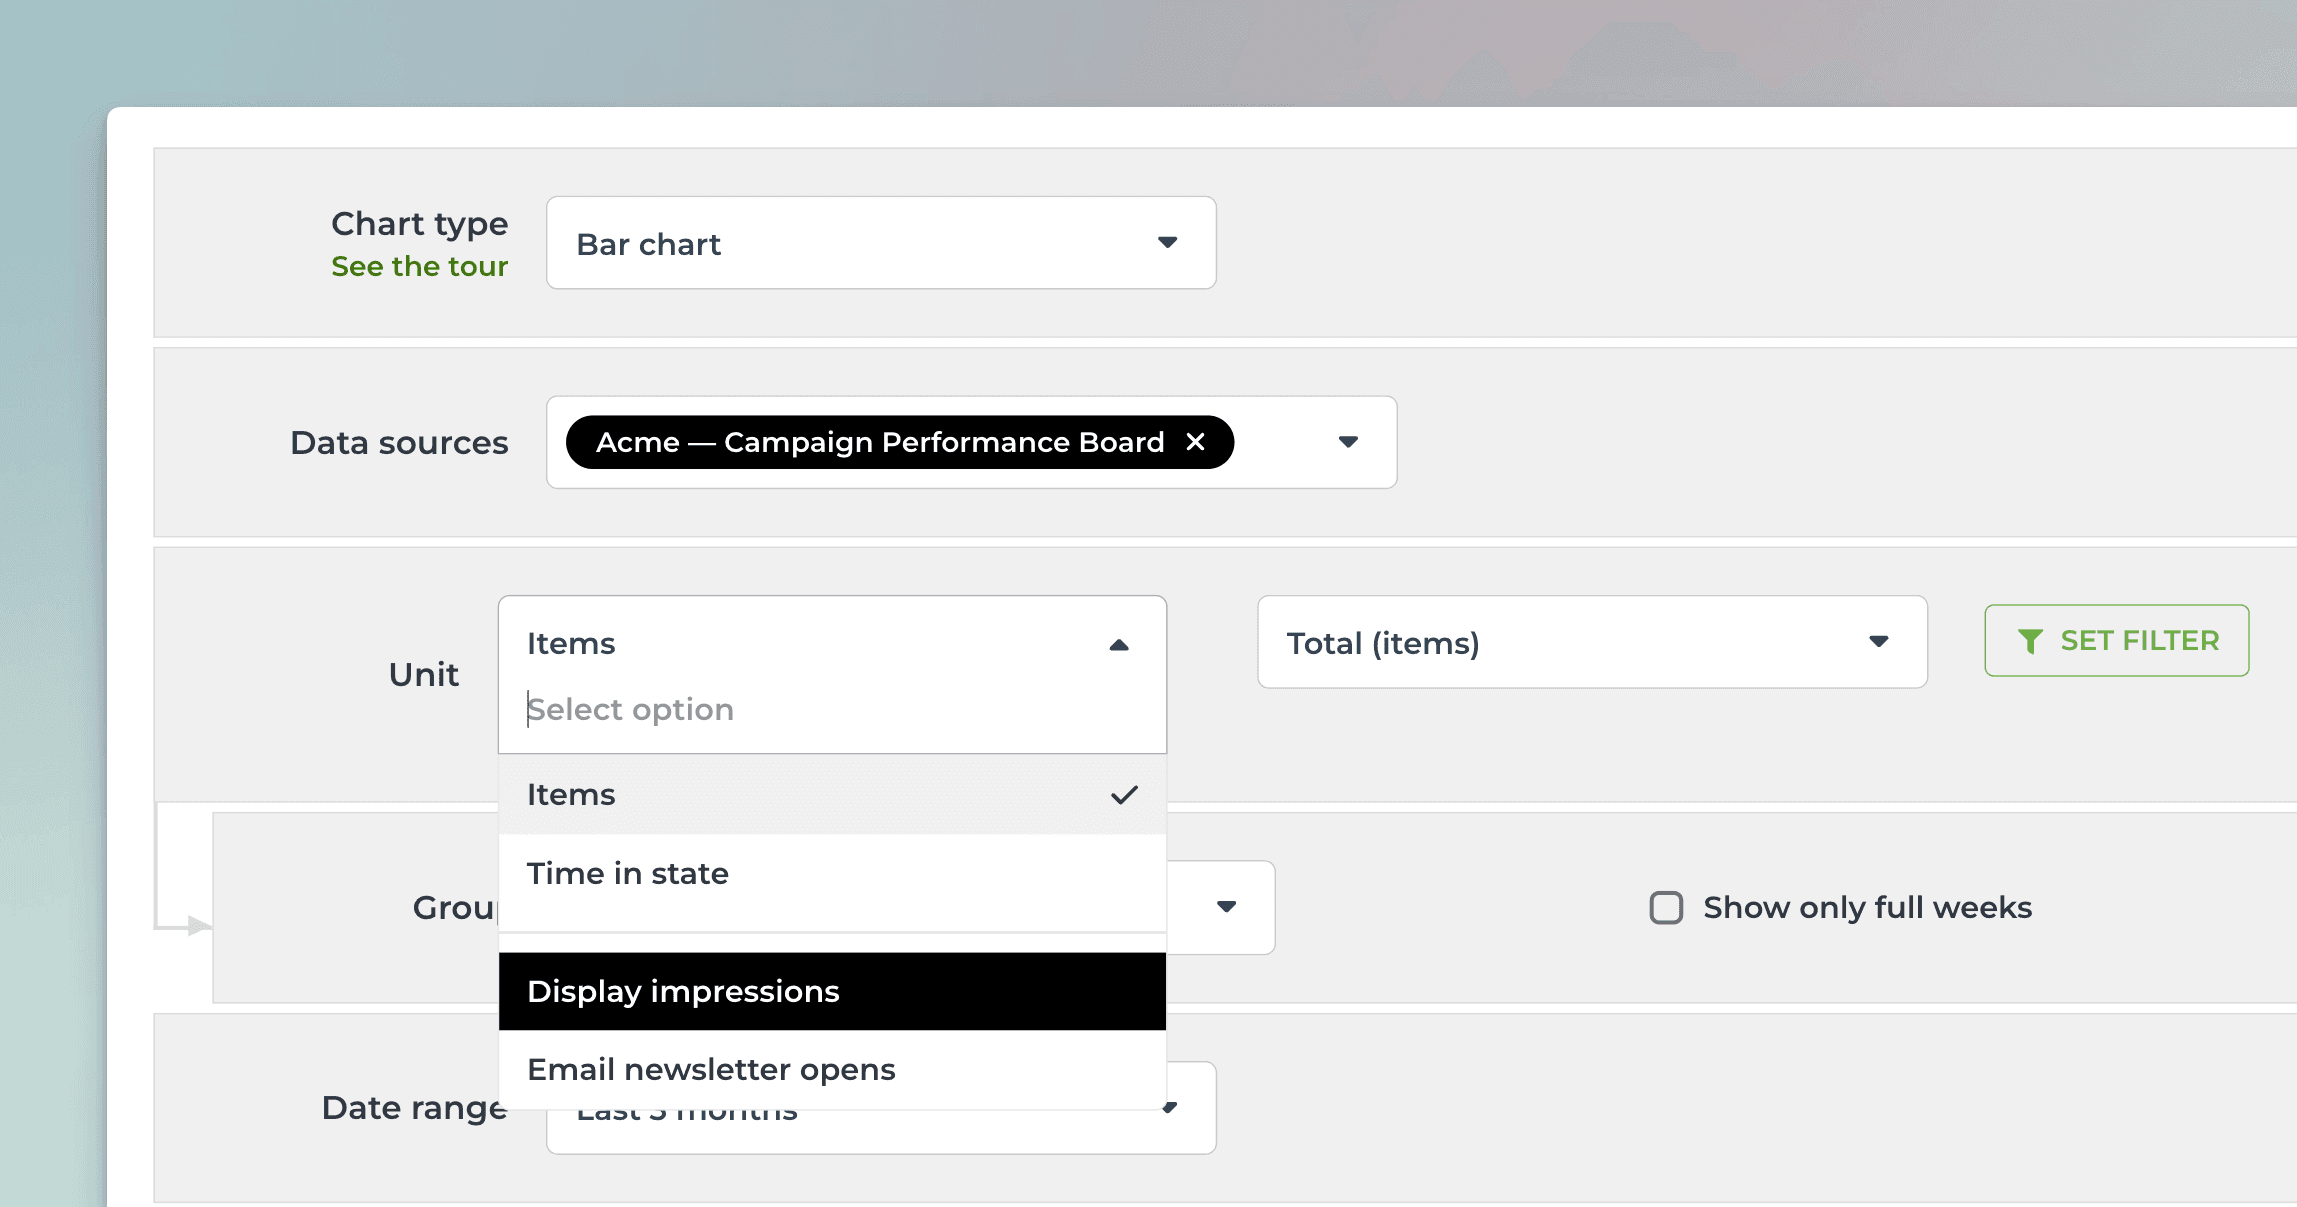
In this example, I have selected Display impressions as the unit for the chart. Here's the resulting chart:
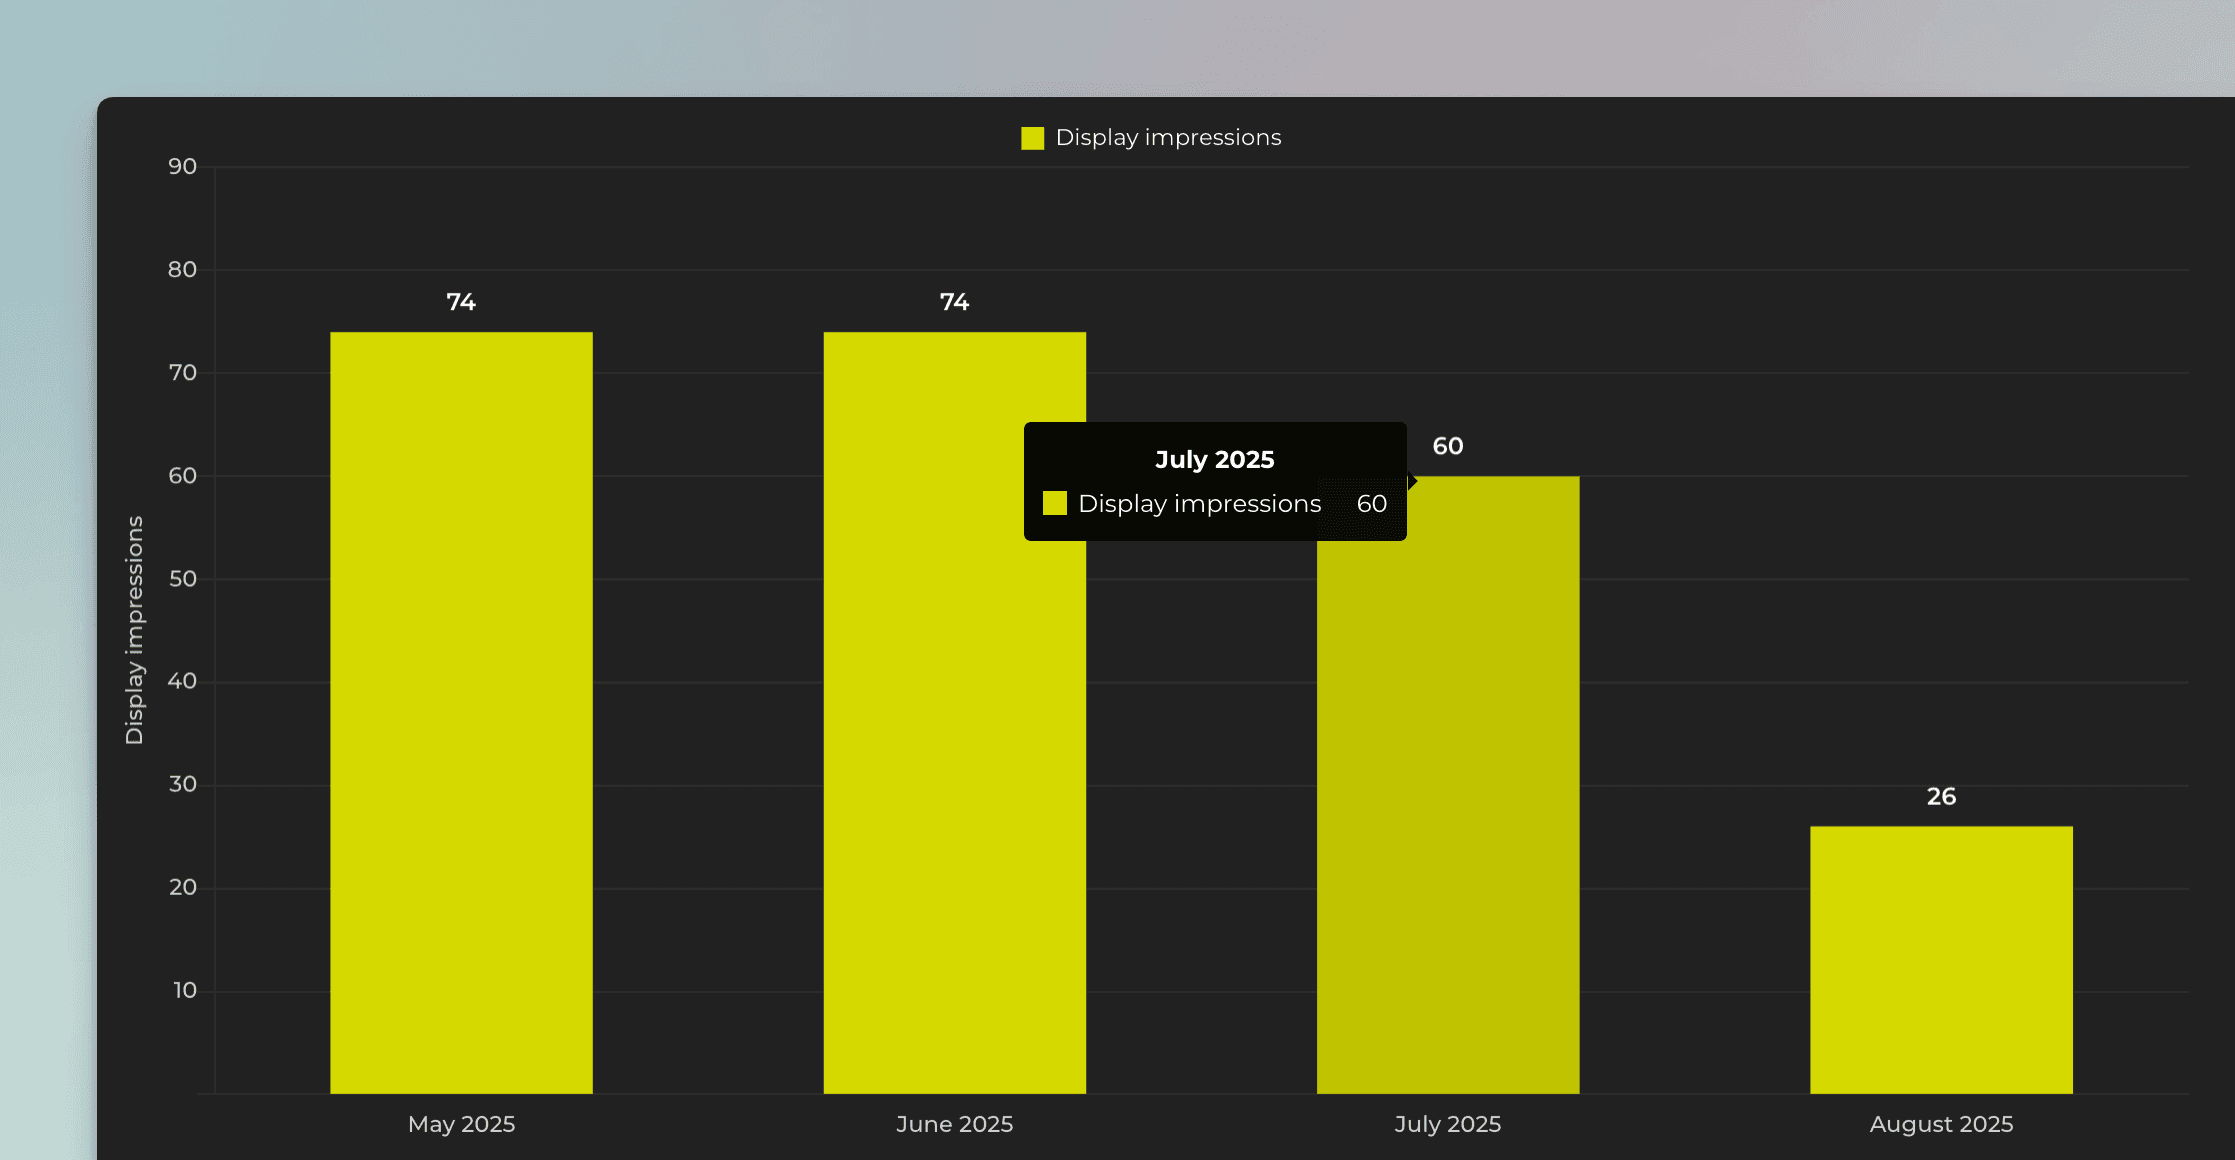
Any of your number fields can be used as a unit in the charts. Data can be aggregated across multiple data sources as long as the name of the custom field is the same in each included data source.
See also:
—-
Screenful is the most advanced analytics add-on for monday.com, Jira, Linear, Asana, Trello, GitHub, and GitLab.
Tracking any number field by date
You can track any custom unit, such as Display impressions, by any date field. All your number fields are selectable in the Unit menu.
In this example, I have selected Display impressions as the unit for the chart. Here's the resulting chart:
Any of your number fields can be used as a unit in the charts. Data can be aggregated across multiple data sources as long as the name of the custom field is the same in each included data source.
See also:
—-
Screenful is the most advanced analytics add-on for monday.com, Jira, Linear, Asana, Trello, GitHub, and GitLab.