The Task list chart helps you to pinpoint tasks that are likely to need your attention, such as those that are delayed or overdue. It allows you to identify what is delaying your team and to act proactively to solve it.
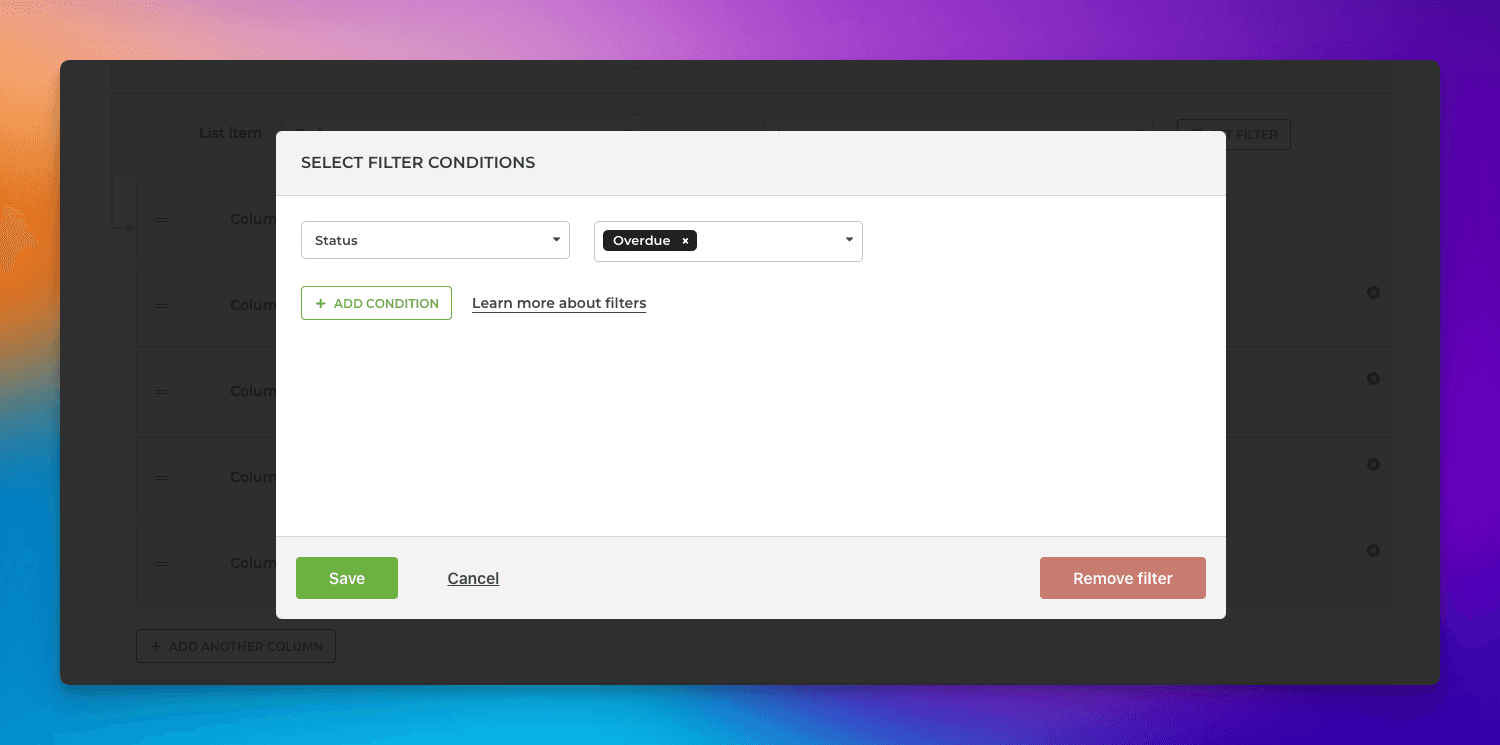
If you’ve set due dates for your tasks, you can track which tasks are overdue, or are about to become overdue. You can see overdue tasks by setting a filter Status > Overdue:
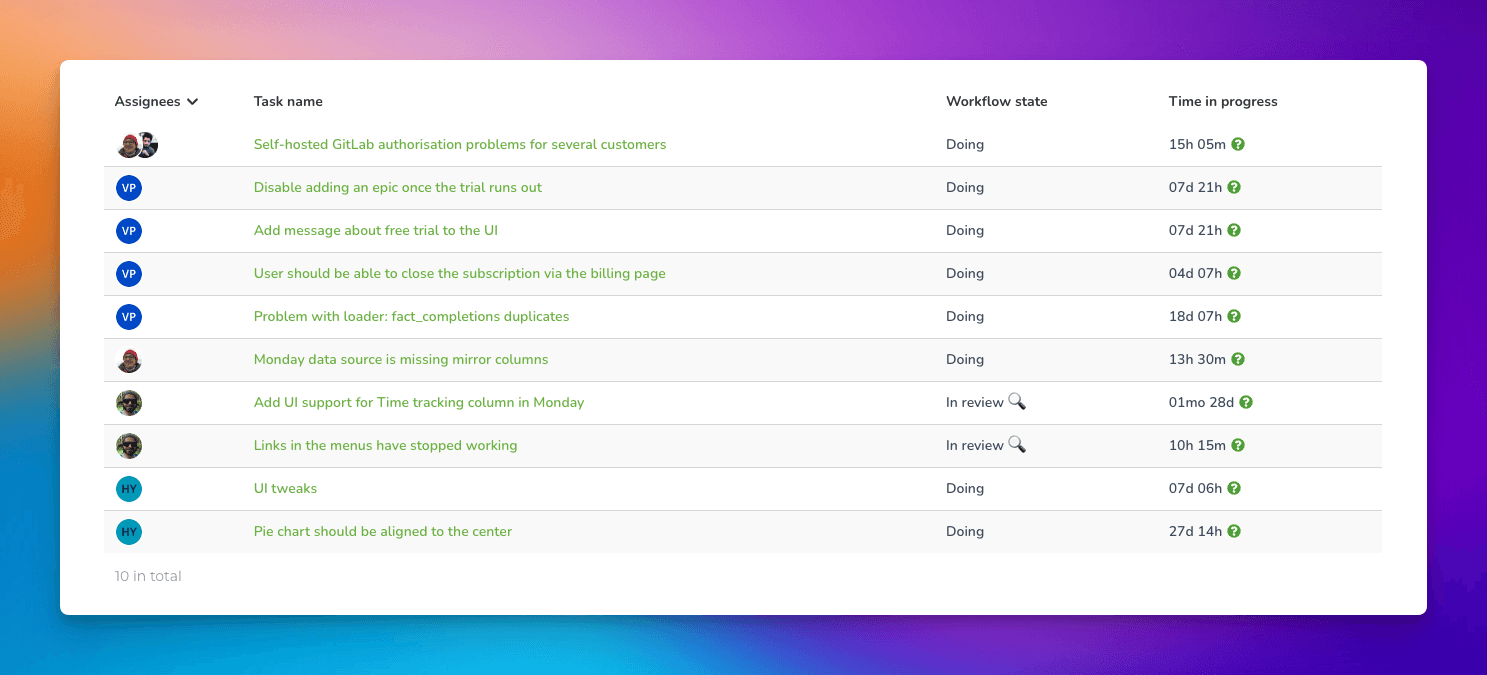
Here's the resulting chart:
To see which tasks are about to become overdue. You can set a filter Due date within the next 5 days:

Here's the resulting chart:

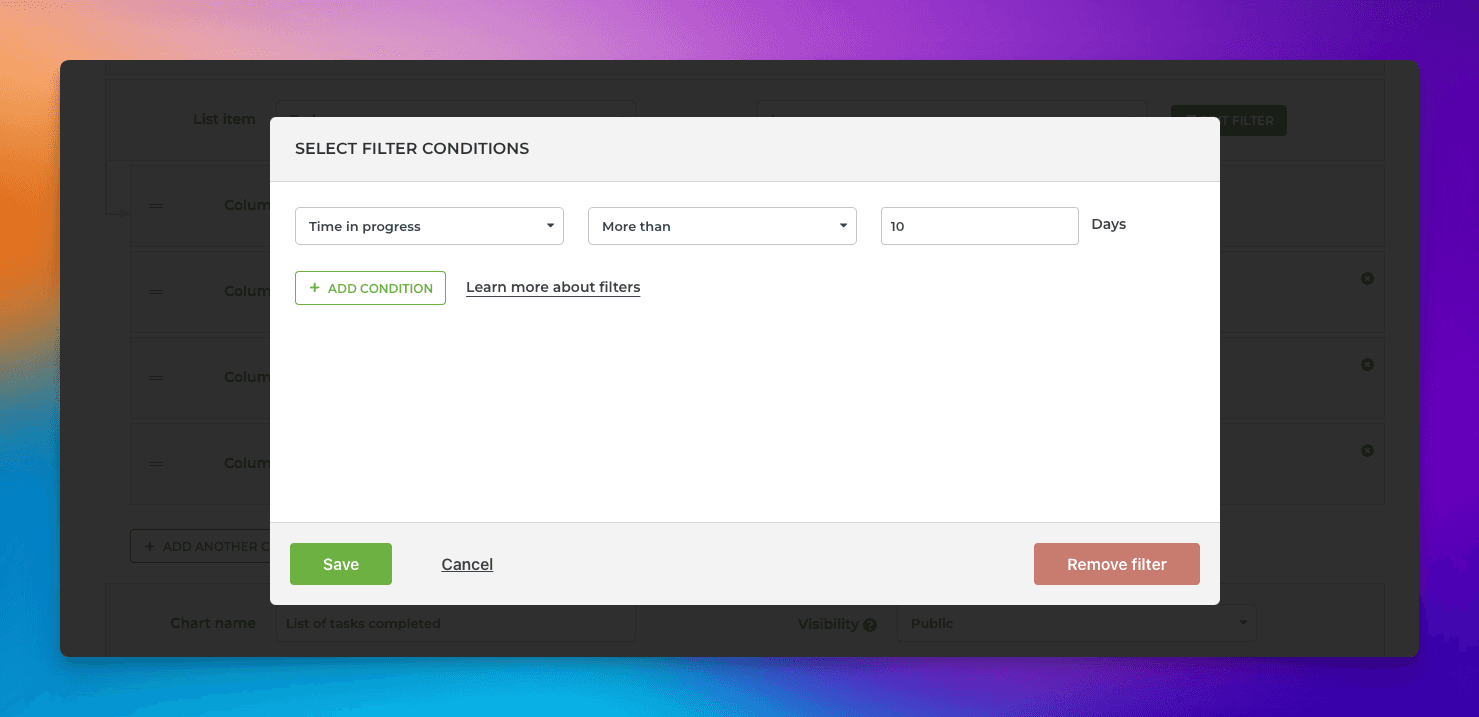
If you’re not using due dates, you still identify delayed tasks by looking at how long they have been in progress. That can give you an early heads-up on tasks likely to cause delays. You can set a filter for displaying tasks that have been In progress for more than 10 days:
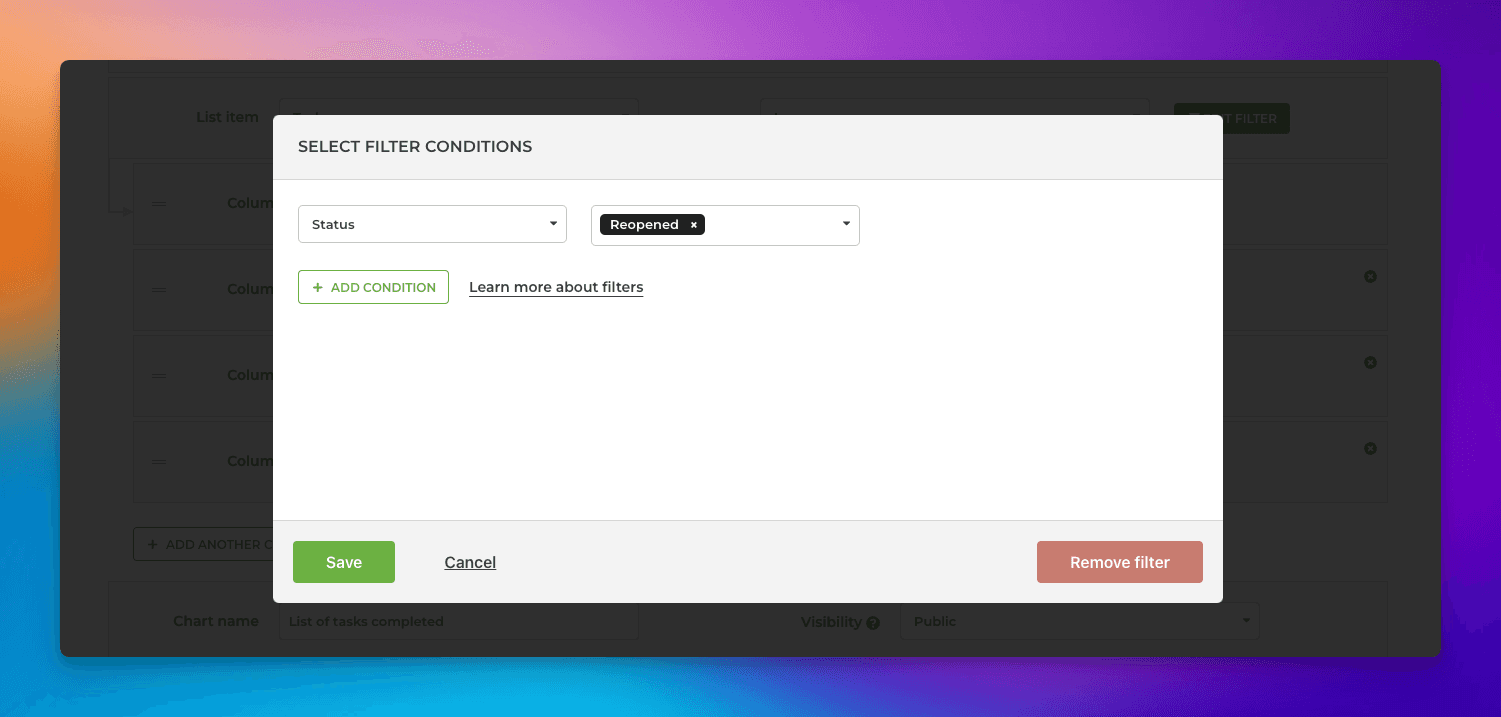
Sometimes, tasks do not progress through the workflow as smoothly as they should. Instead, they move back and forth between workflow states. This is often a symptom of insufficient planning or a weak quality assurance process. You can find out which tasks have been first completed but then moved back to In progress by selecting Status > Reopened as the filter:
Looking at the outliers in your data can help you pinpoint problem areas and find the tasks that need your attention so that you can proactively tackle them before they start affecting the execution of your project.
Learn more
Book a free onboarding call
Need help with setting up your charts and reports? Don't find a metric you are looking for? Book a call with our expert. We'd love to help you supercharge your reporting!


