You can customize your reports by adjusting the layout and the color theme. You can also add your company logo to the report footer. This guide shows how to customize your reports.
Adding columns to a report
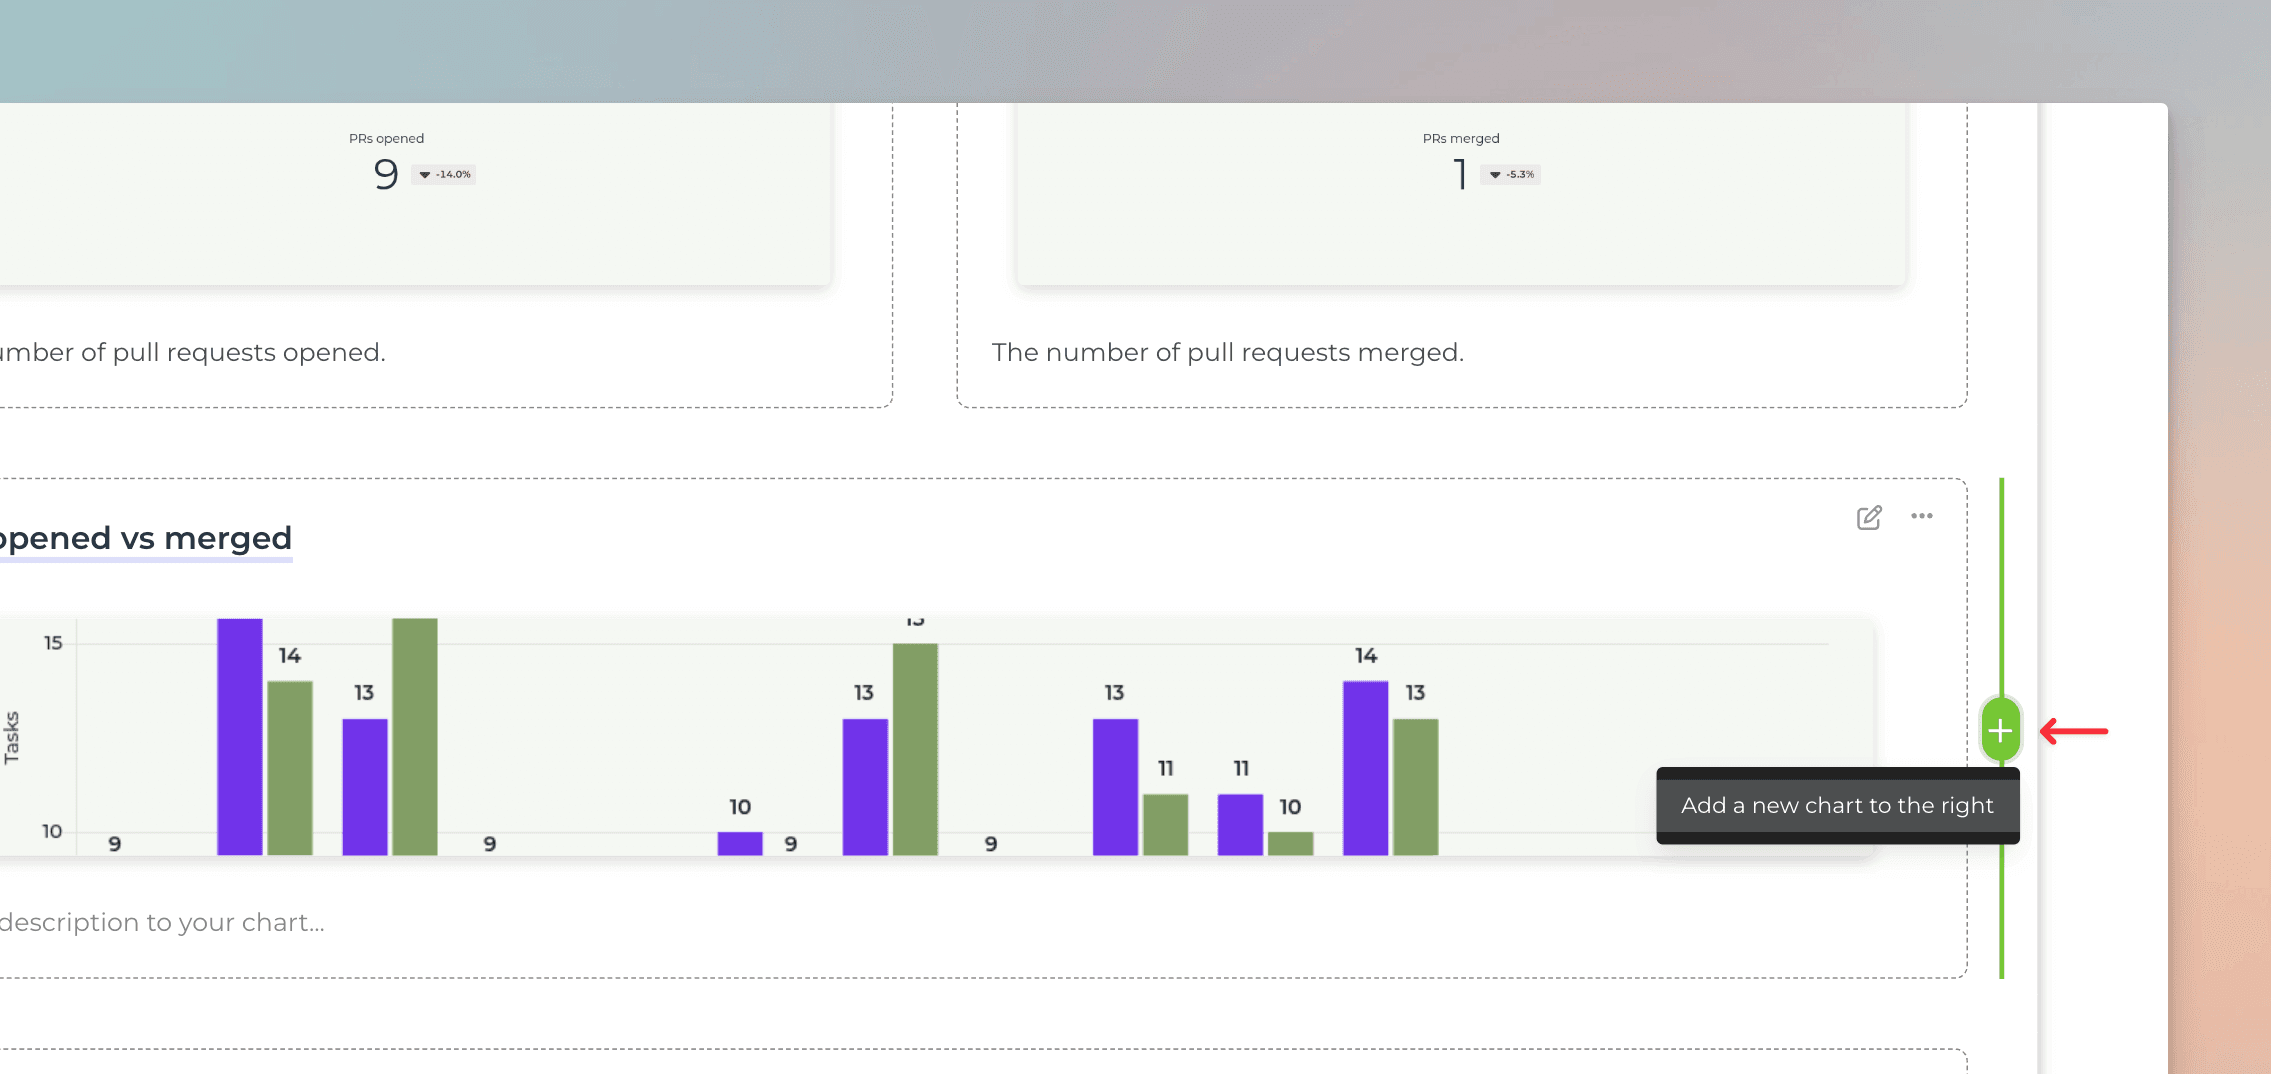
The content in a report can be in one or two columns. One chart can take the whole width, or you can set any two charts side by side. You can also mix them with the text blocks so you can have two custom charts in the same row, or two text blocks, or charts and text blocks mixed.
To split a row into two columns, hover over either side of an existing chart, click the “+” button, and select Add a new chart:
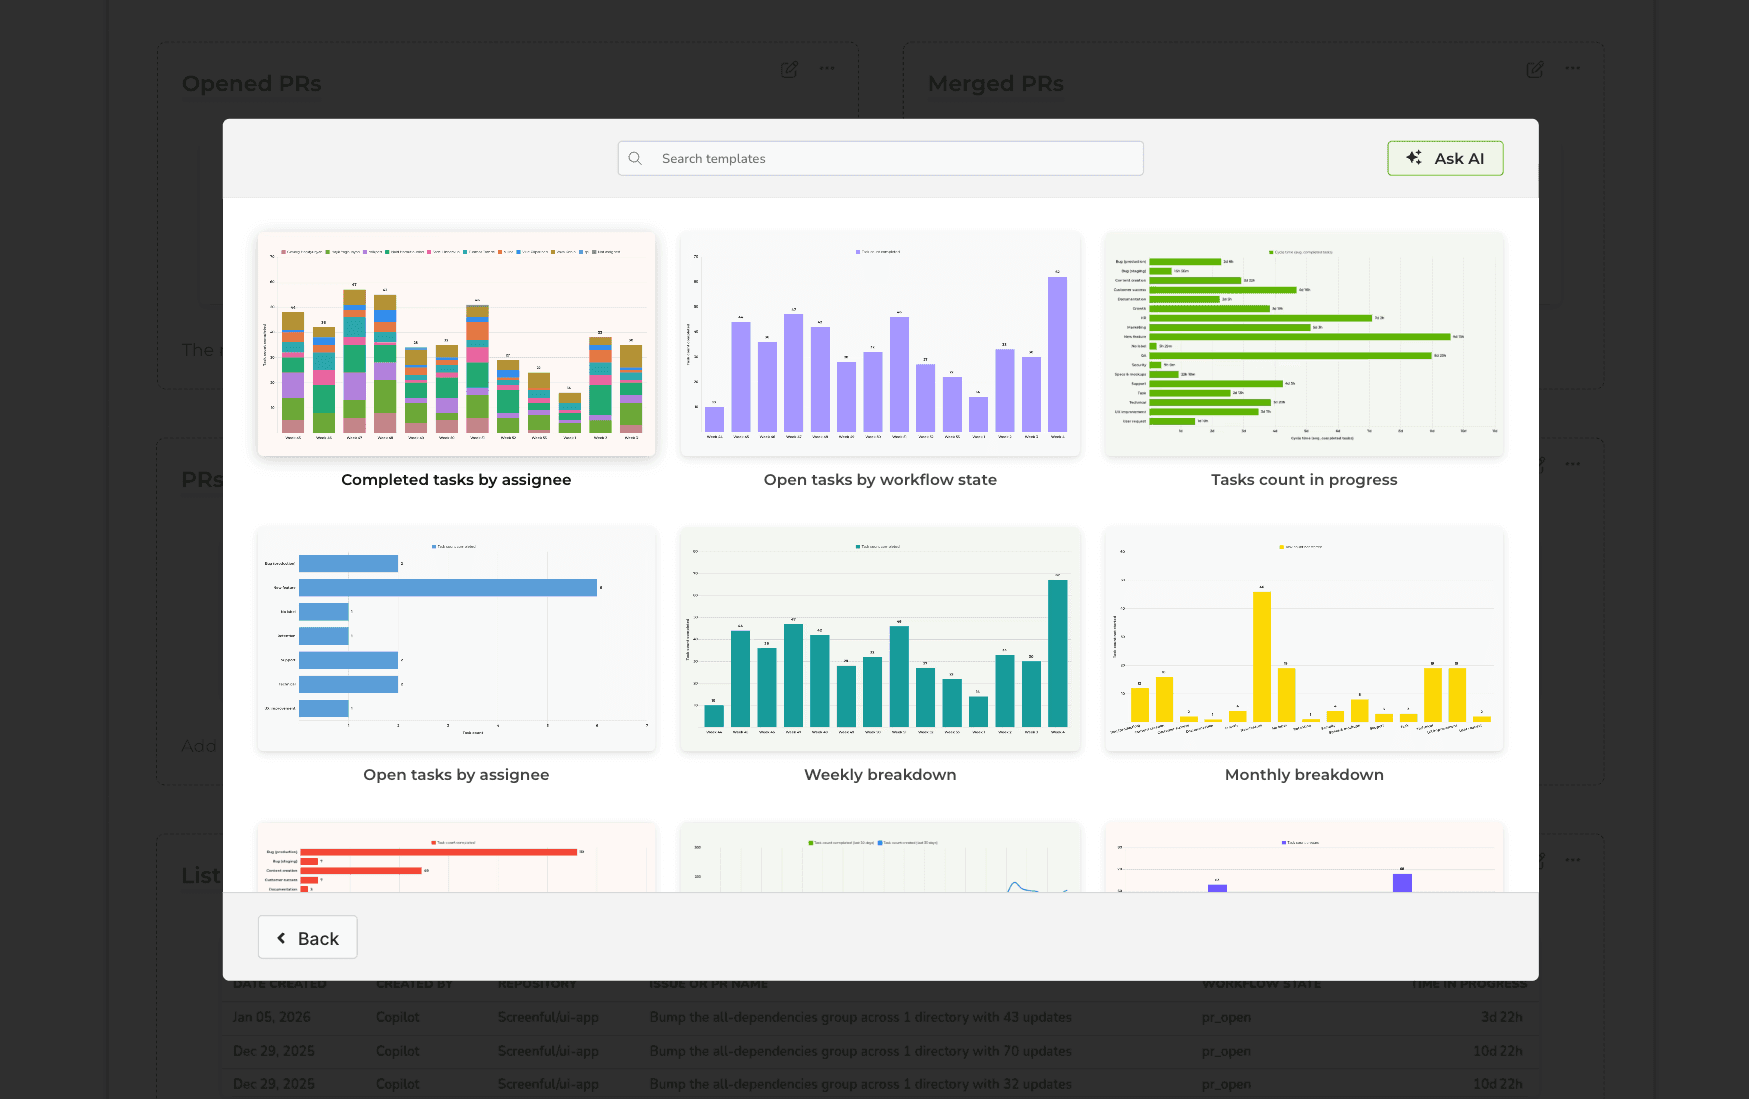
A modal is opened with a set of chart templates. You can either use one of the existing charts, create a new chart from the template gallery, or create a new chart from scratch.
Customize with colors and logo
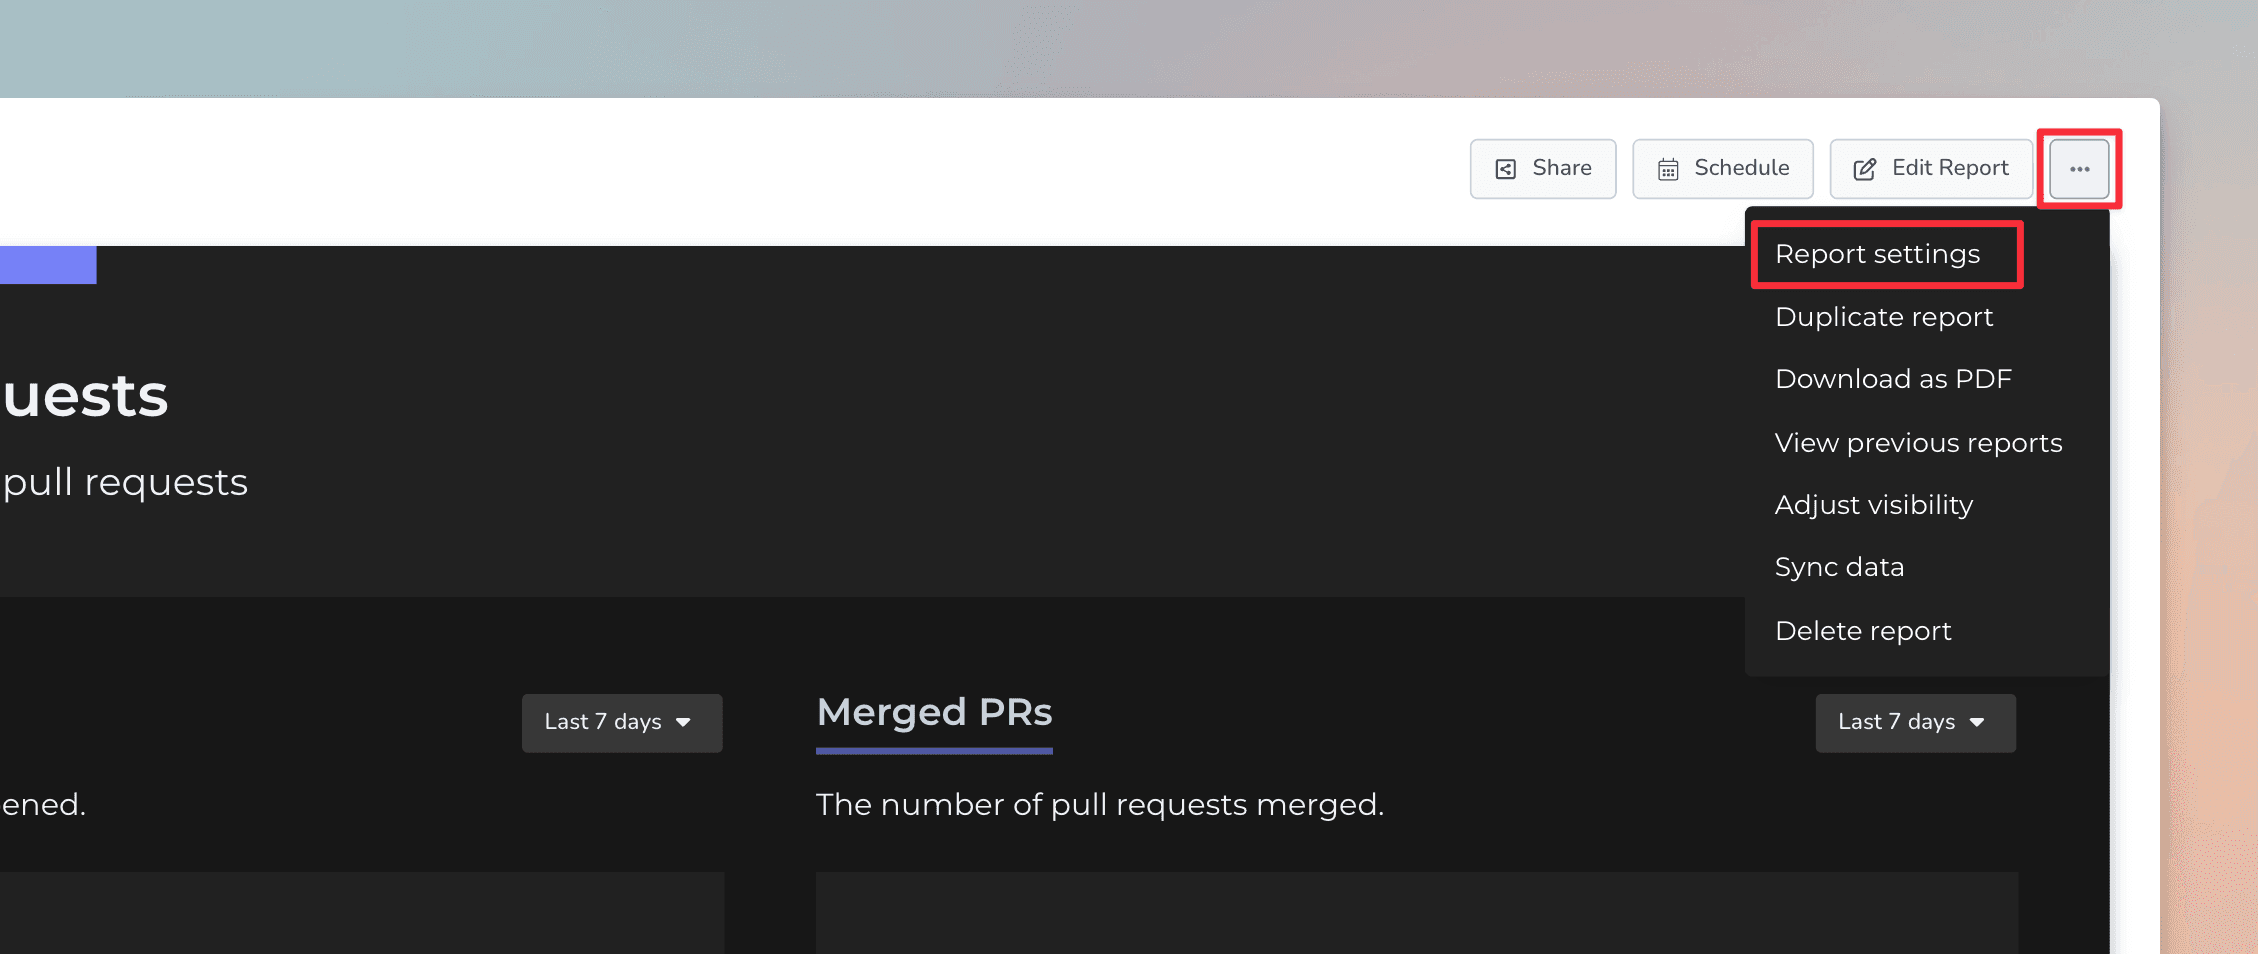
You can find more customisation options by selecting Report settings from the three-dots menu:
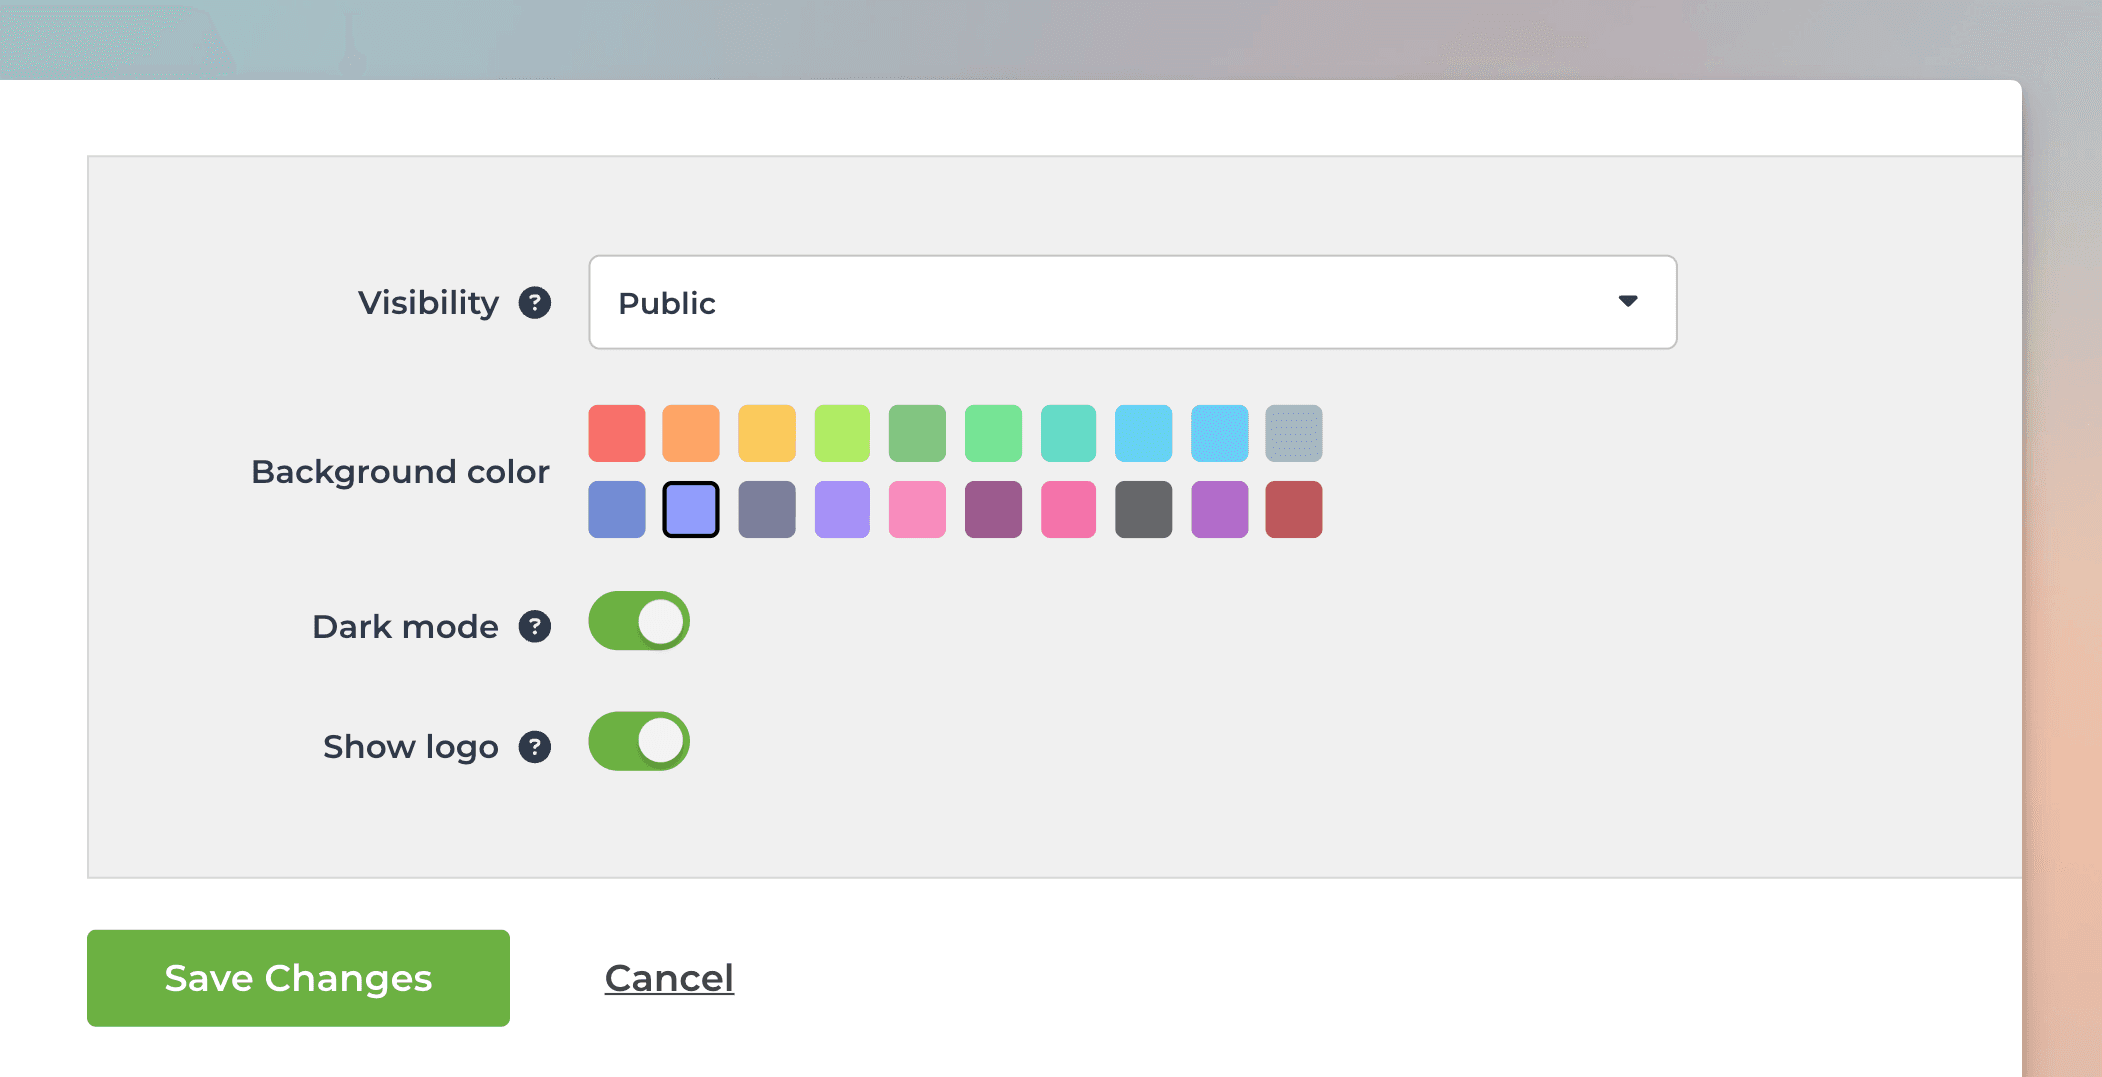
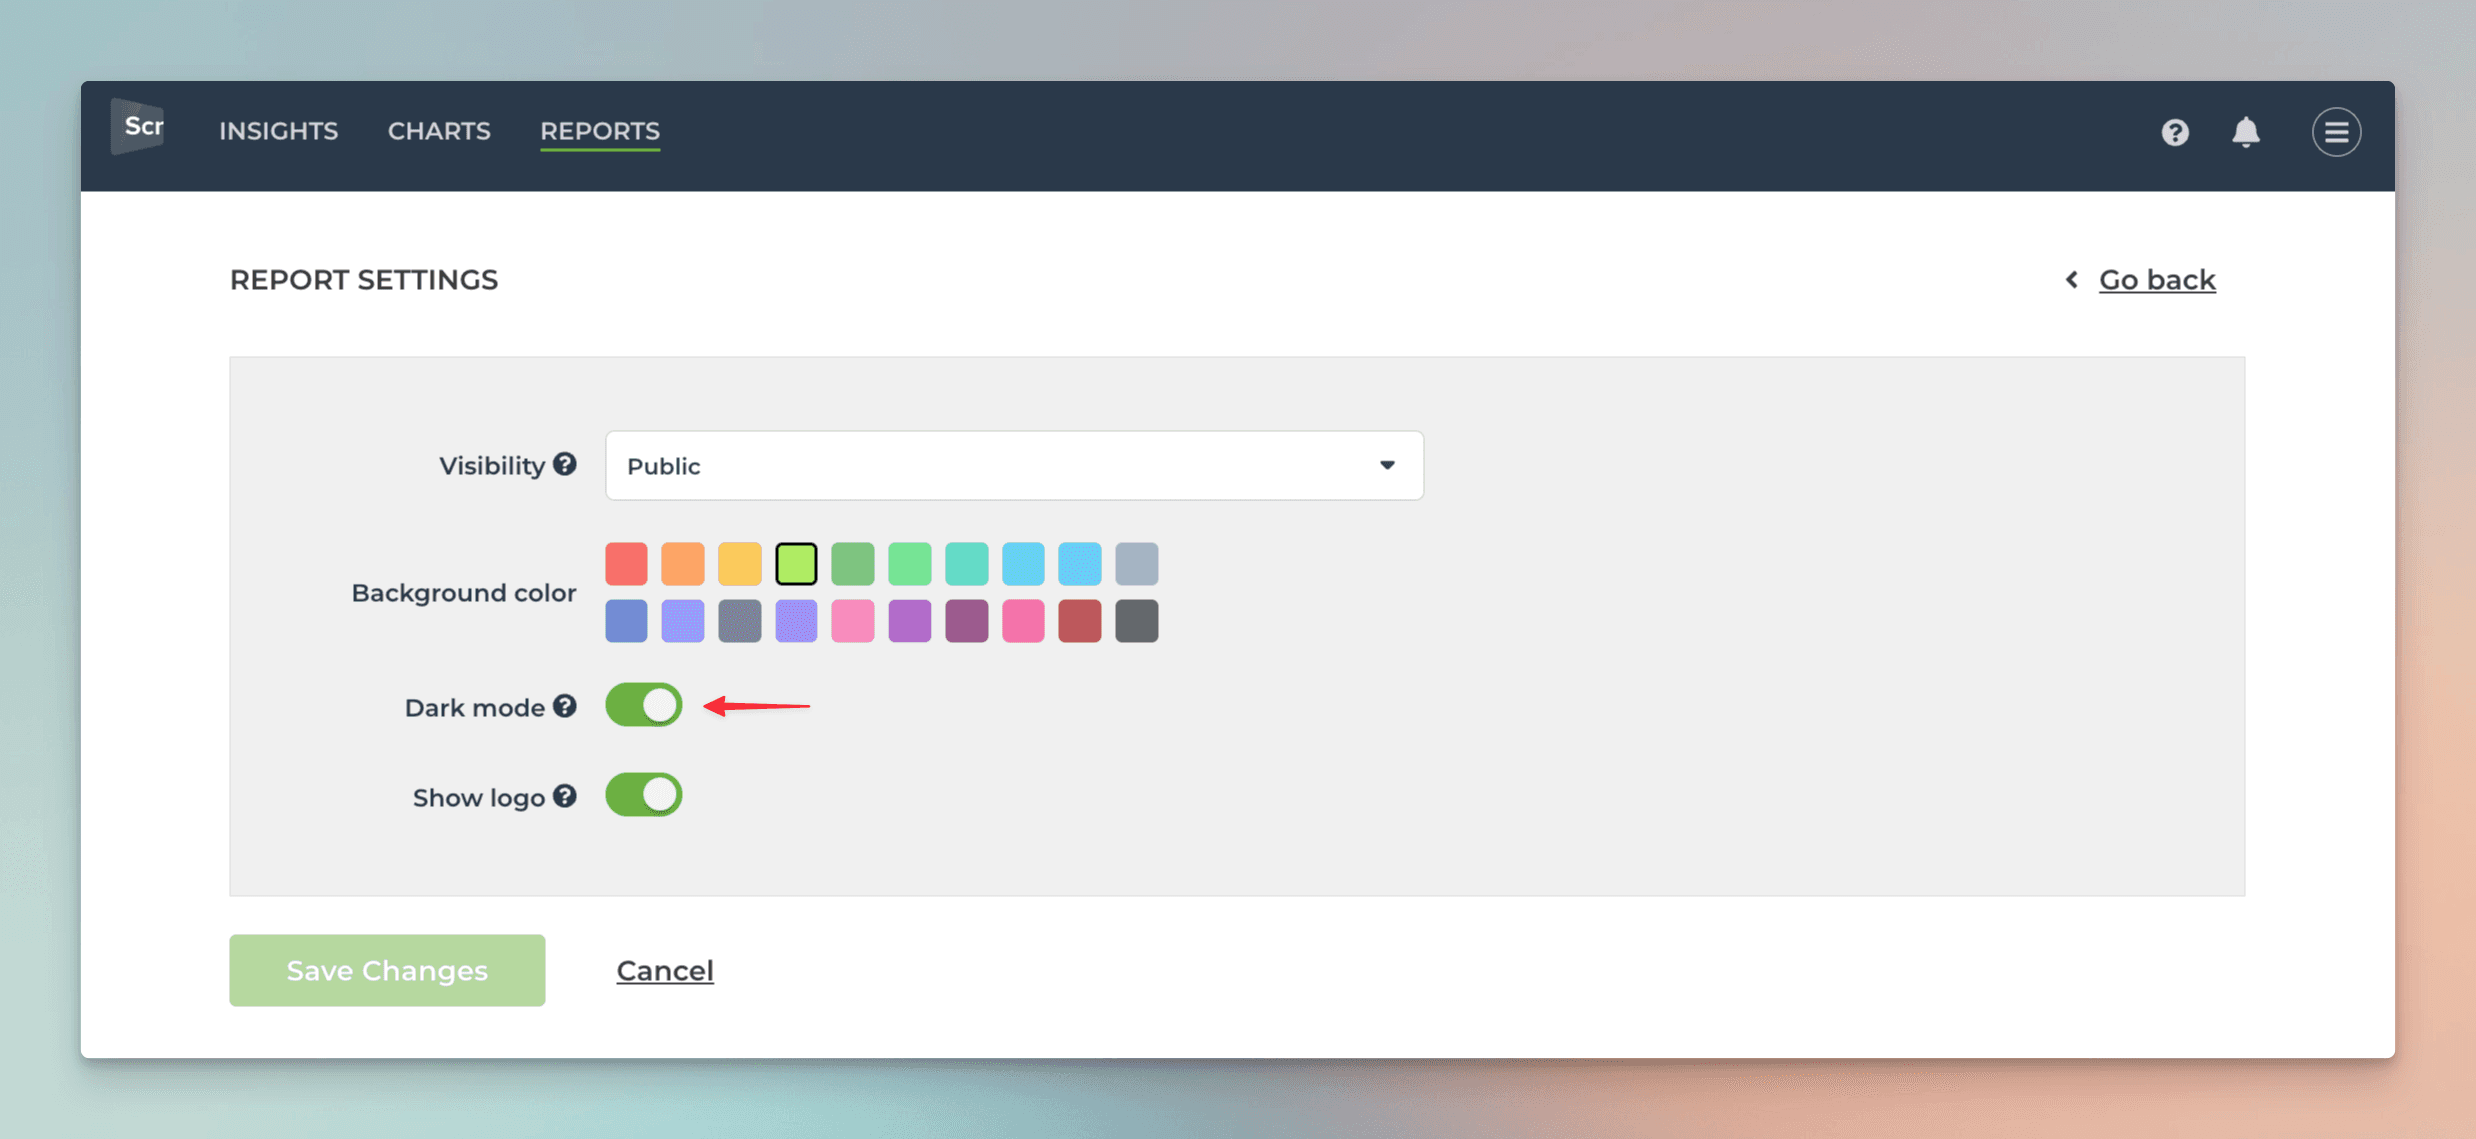
In the report settings, you can adjust the report’s visibility, select a color theme, and add a custom logo.
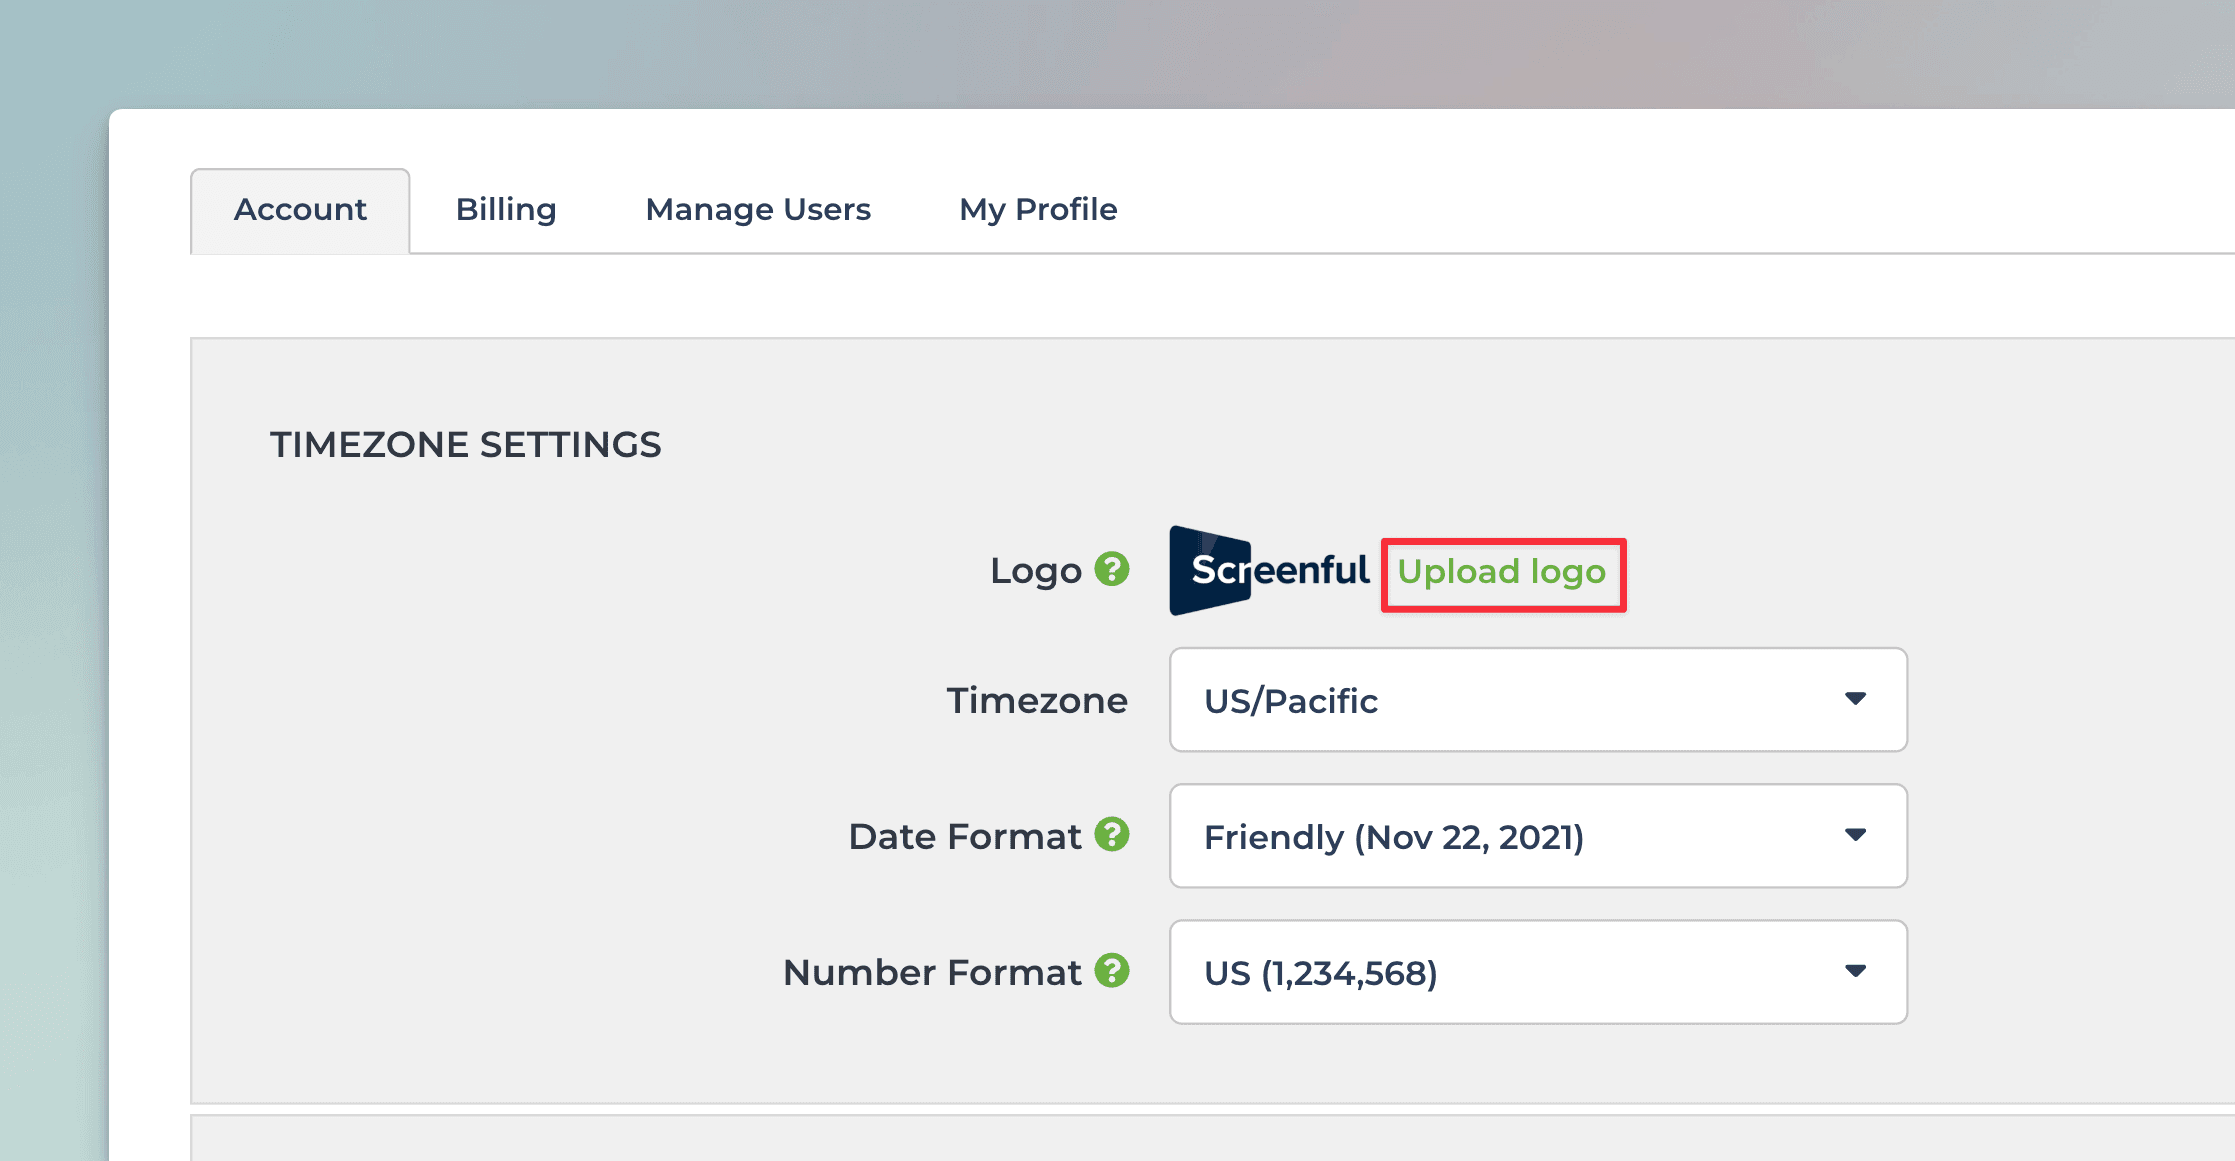
To add a logo to the report, you first need to upload the logo file in the Account settings:
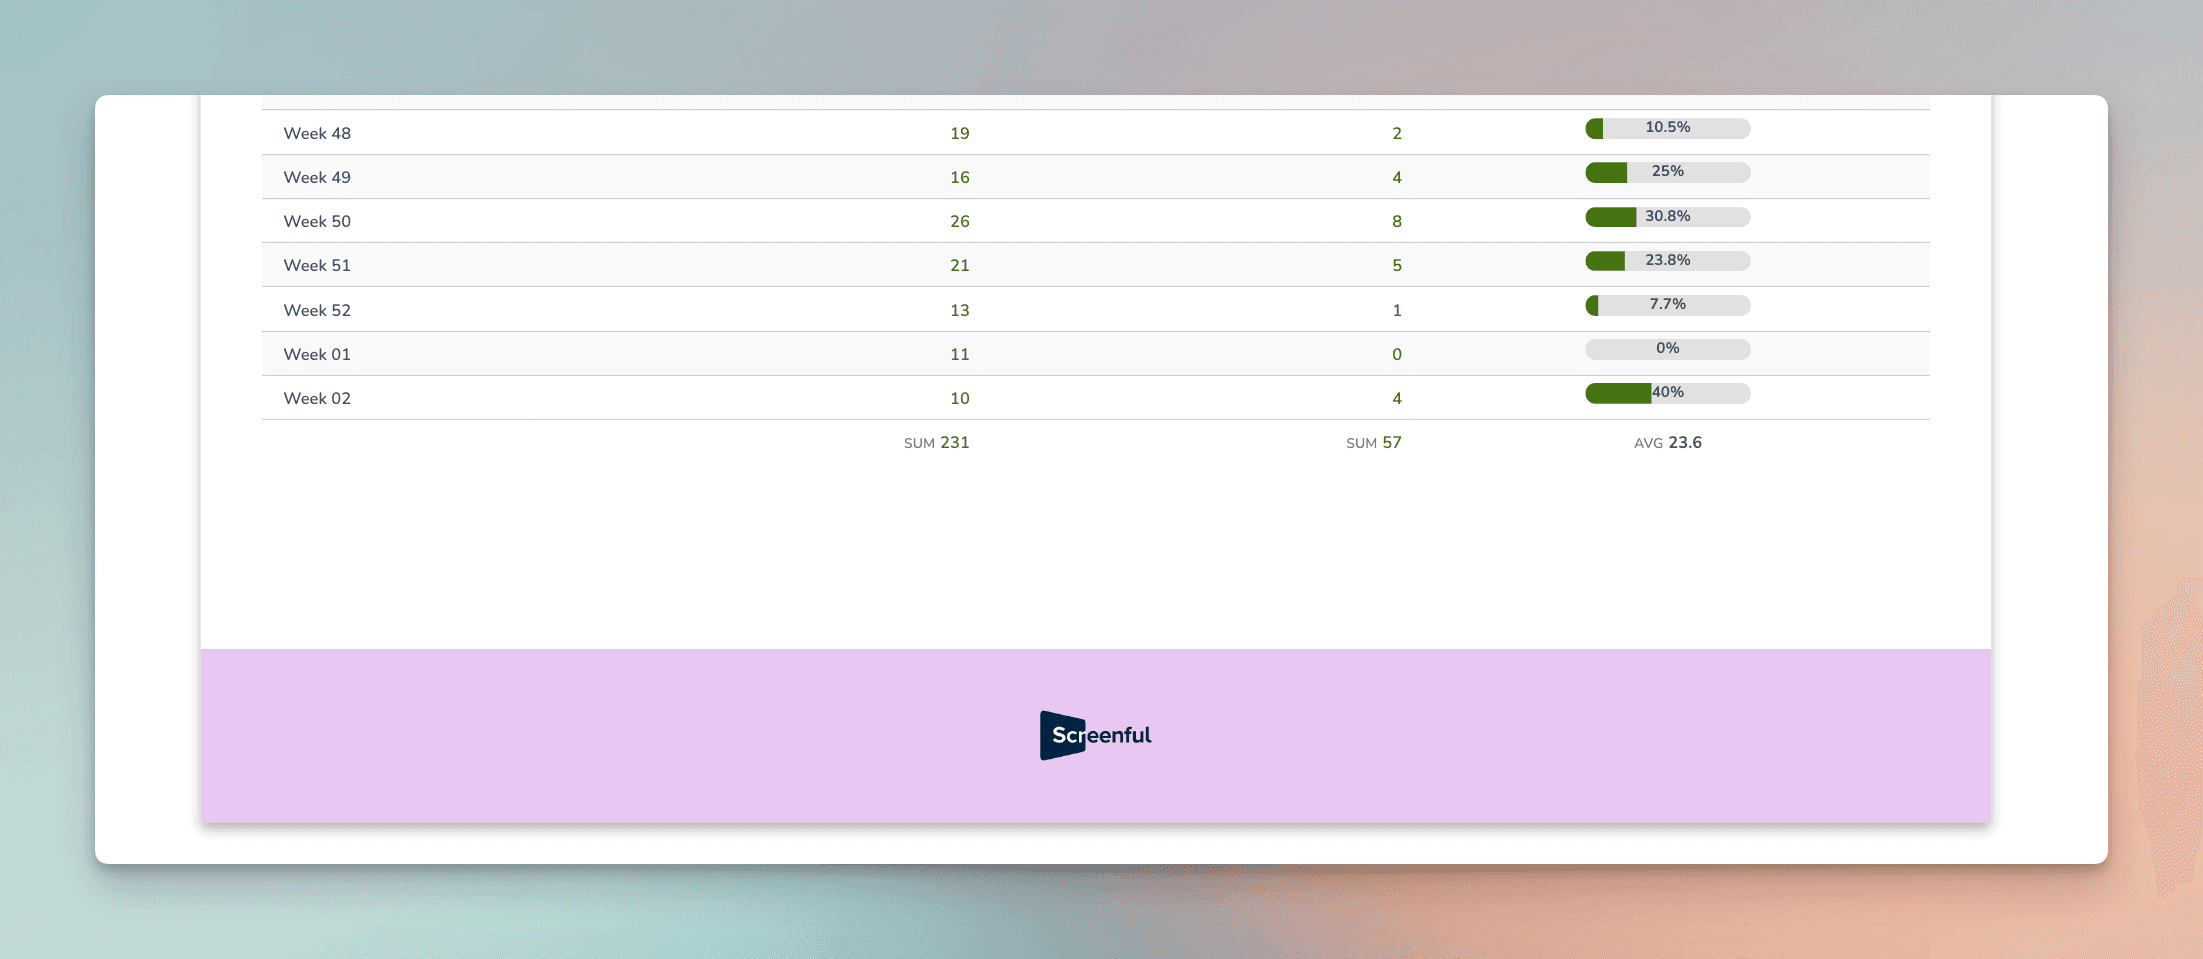
Once you’ve uploaded the logo, the logo will appear on the report footer for those reports that have the Show logo enabled in the report settings:
Switching to dark mode
If you prefer viewing the report in dark mode, we got you covered. In the report settings, you’ll find the Dark mode slider
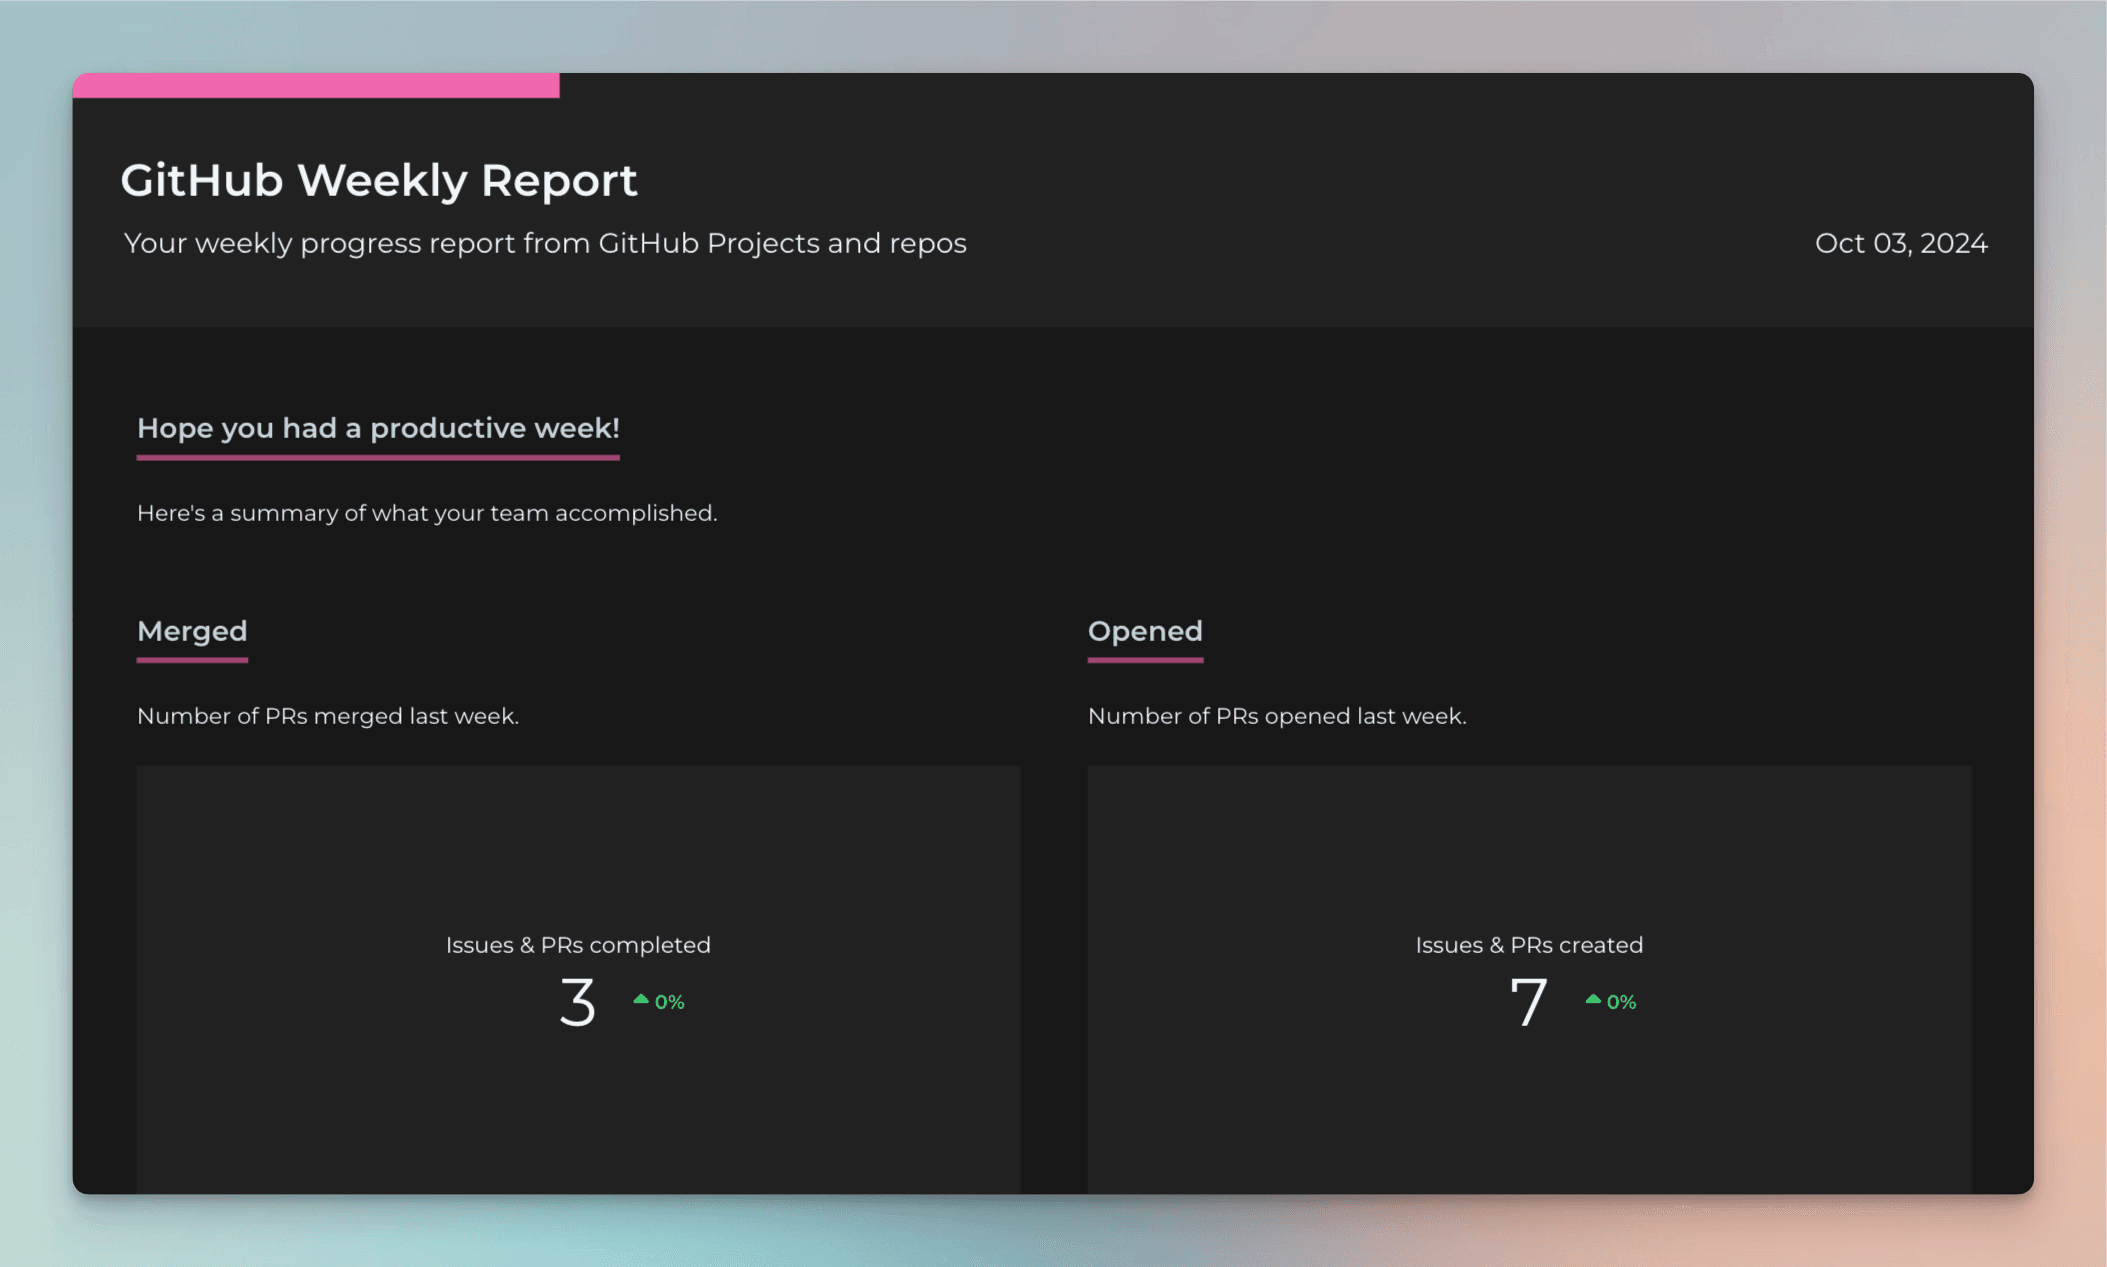
When you click the slider, the report switches to the dark mode. In this mode, all charts within the report are automatically switched to dark mode.
Learn more
Book a free onboarding call
Need help with setting up your charts and reports? Don't find a metric you are looking for? Book a call with our expert. We'd love to help you supercharge your reporting!


