You can export data from individual charts in CSV or JSON. When you click through from a chart, you can export the click-through list in CSV. You can export reports in PDF or schedule data exports in CSV to email.
Export charts in CSV or JSON
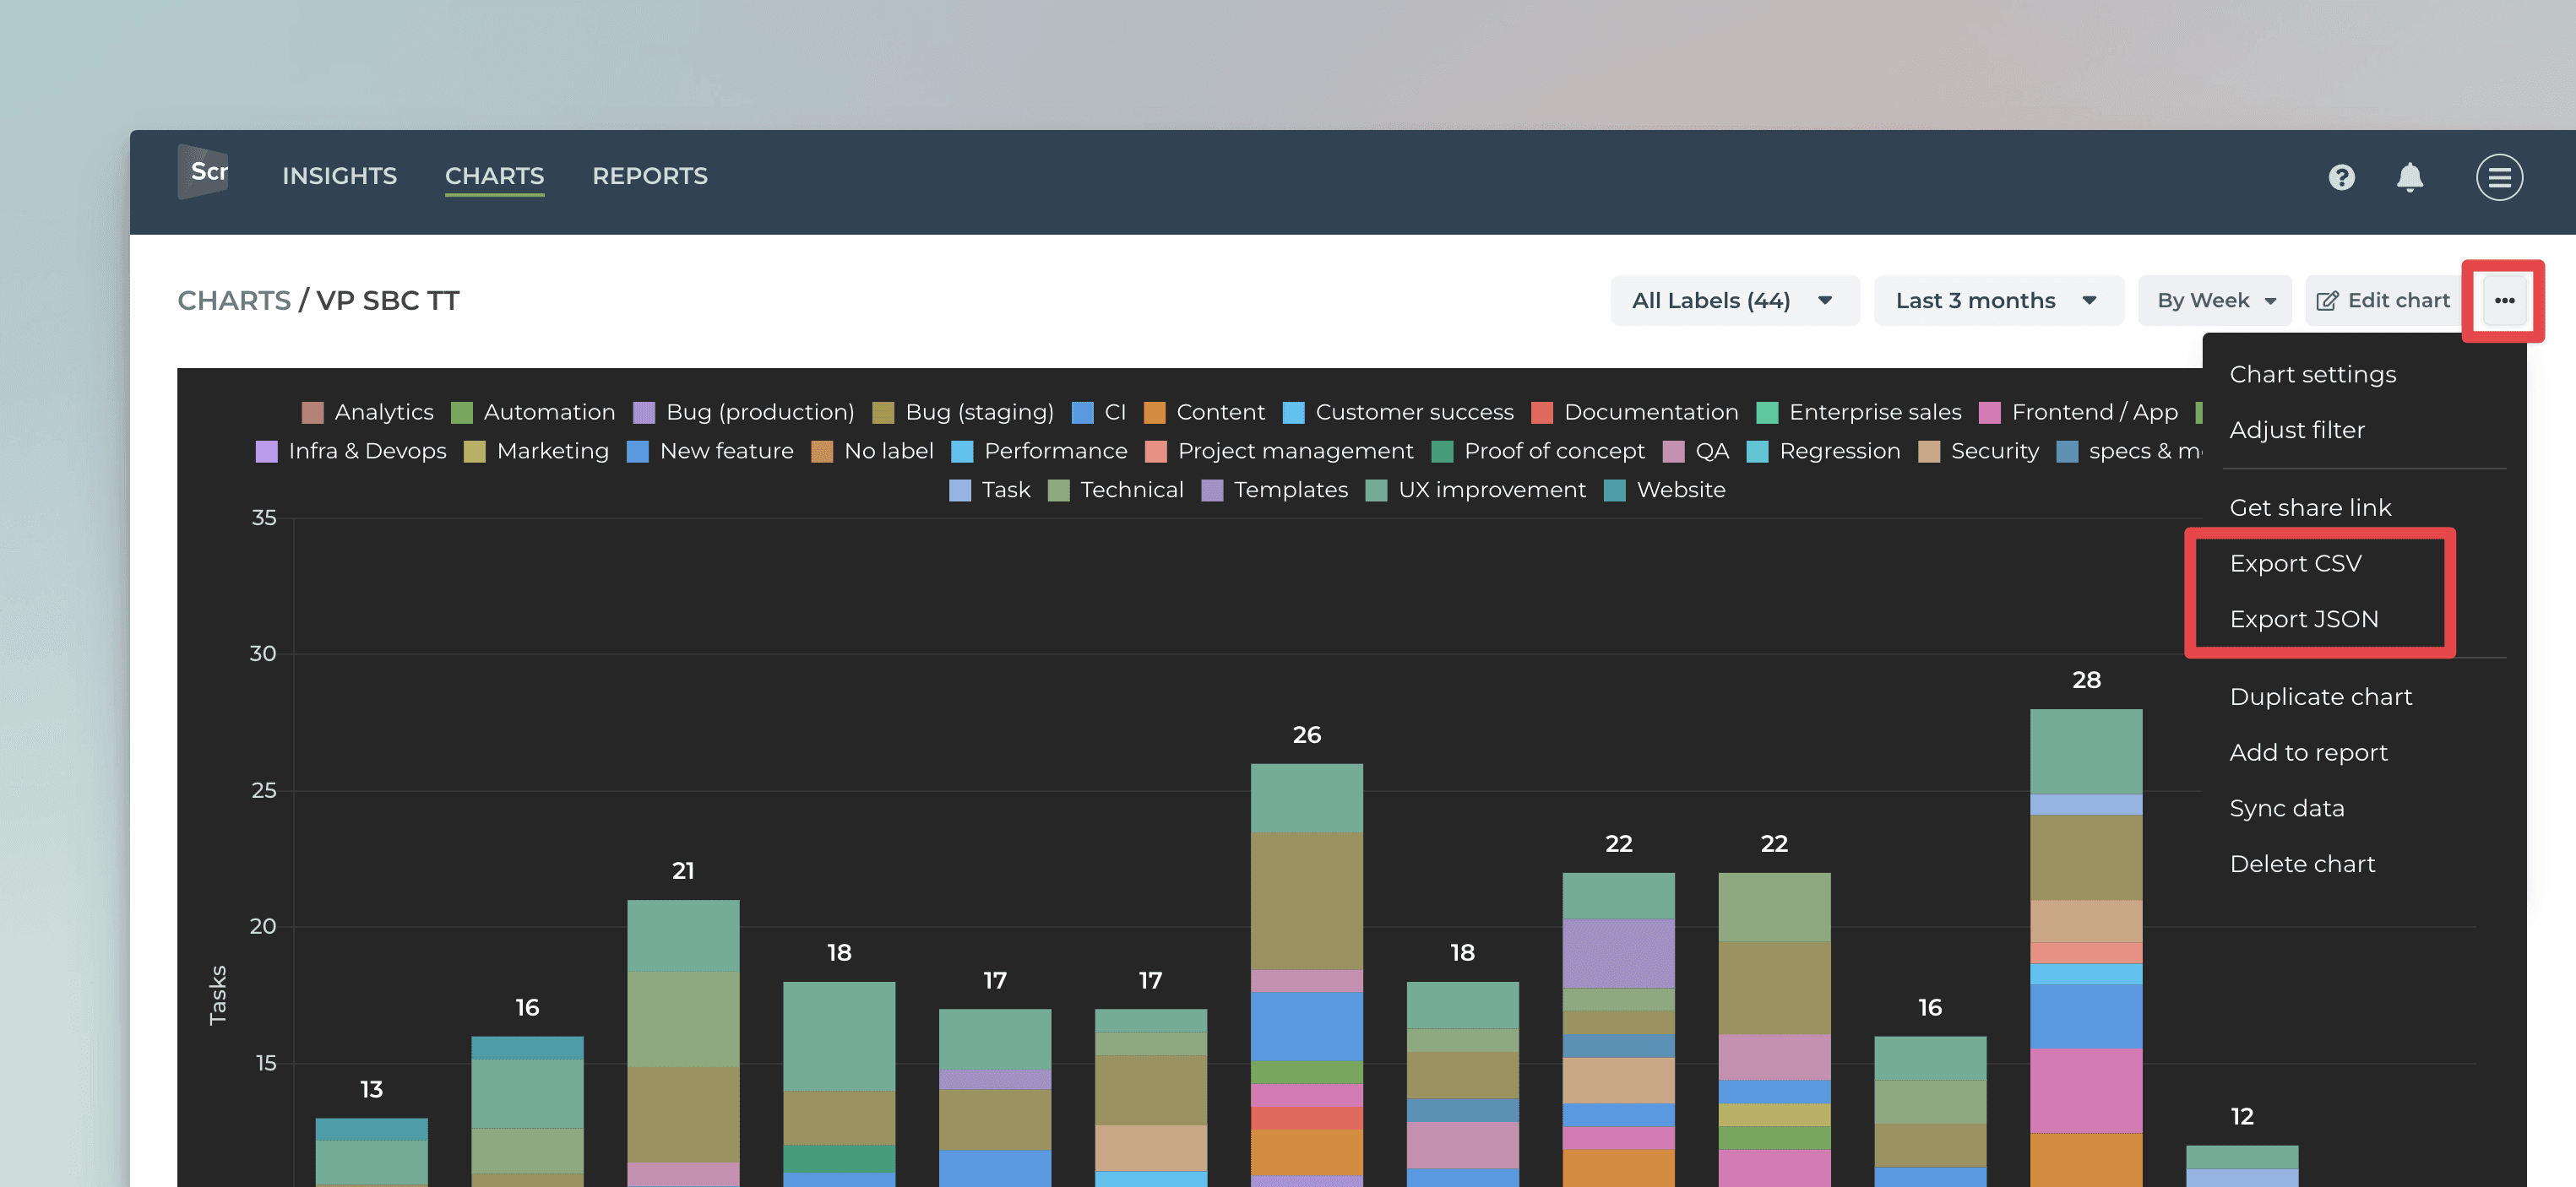
When viewing a chart under the Charts tab, you can export data in CSV or JSON by clicking the three dots menu in the top right corner.
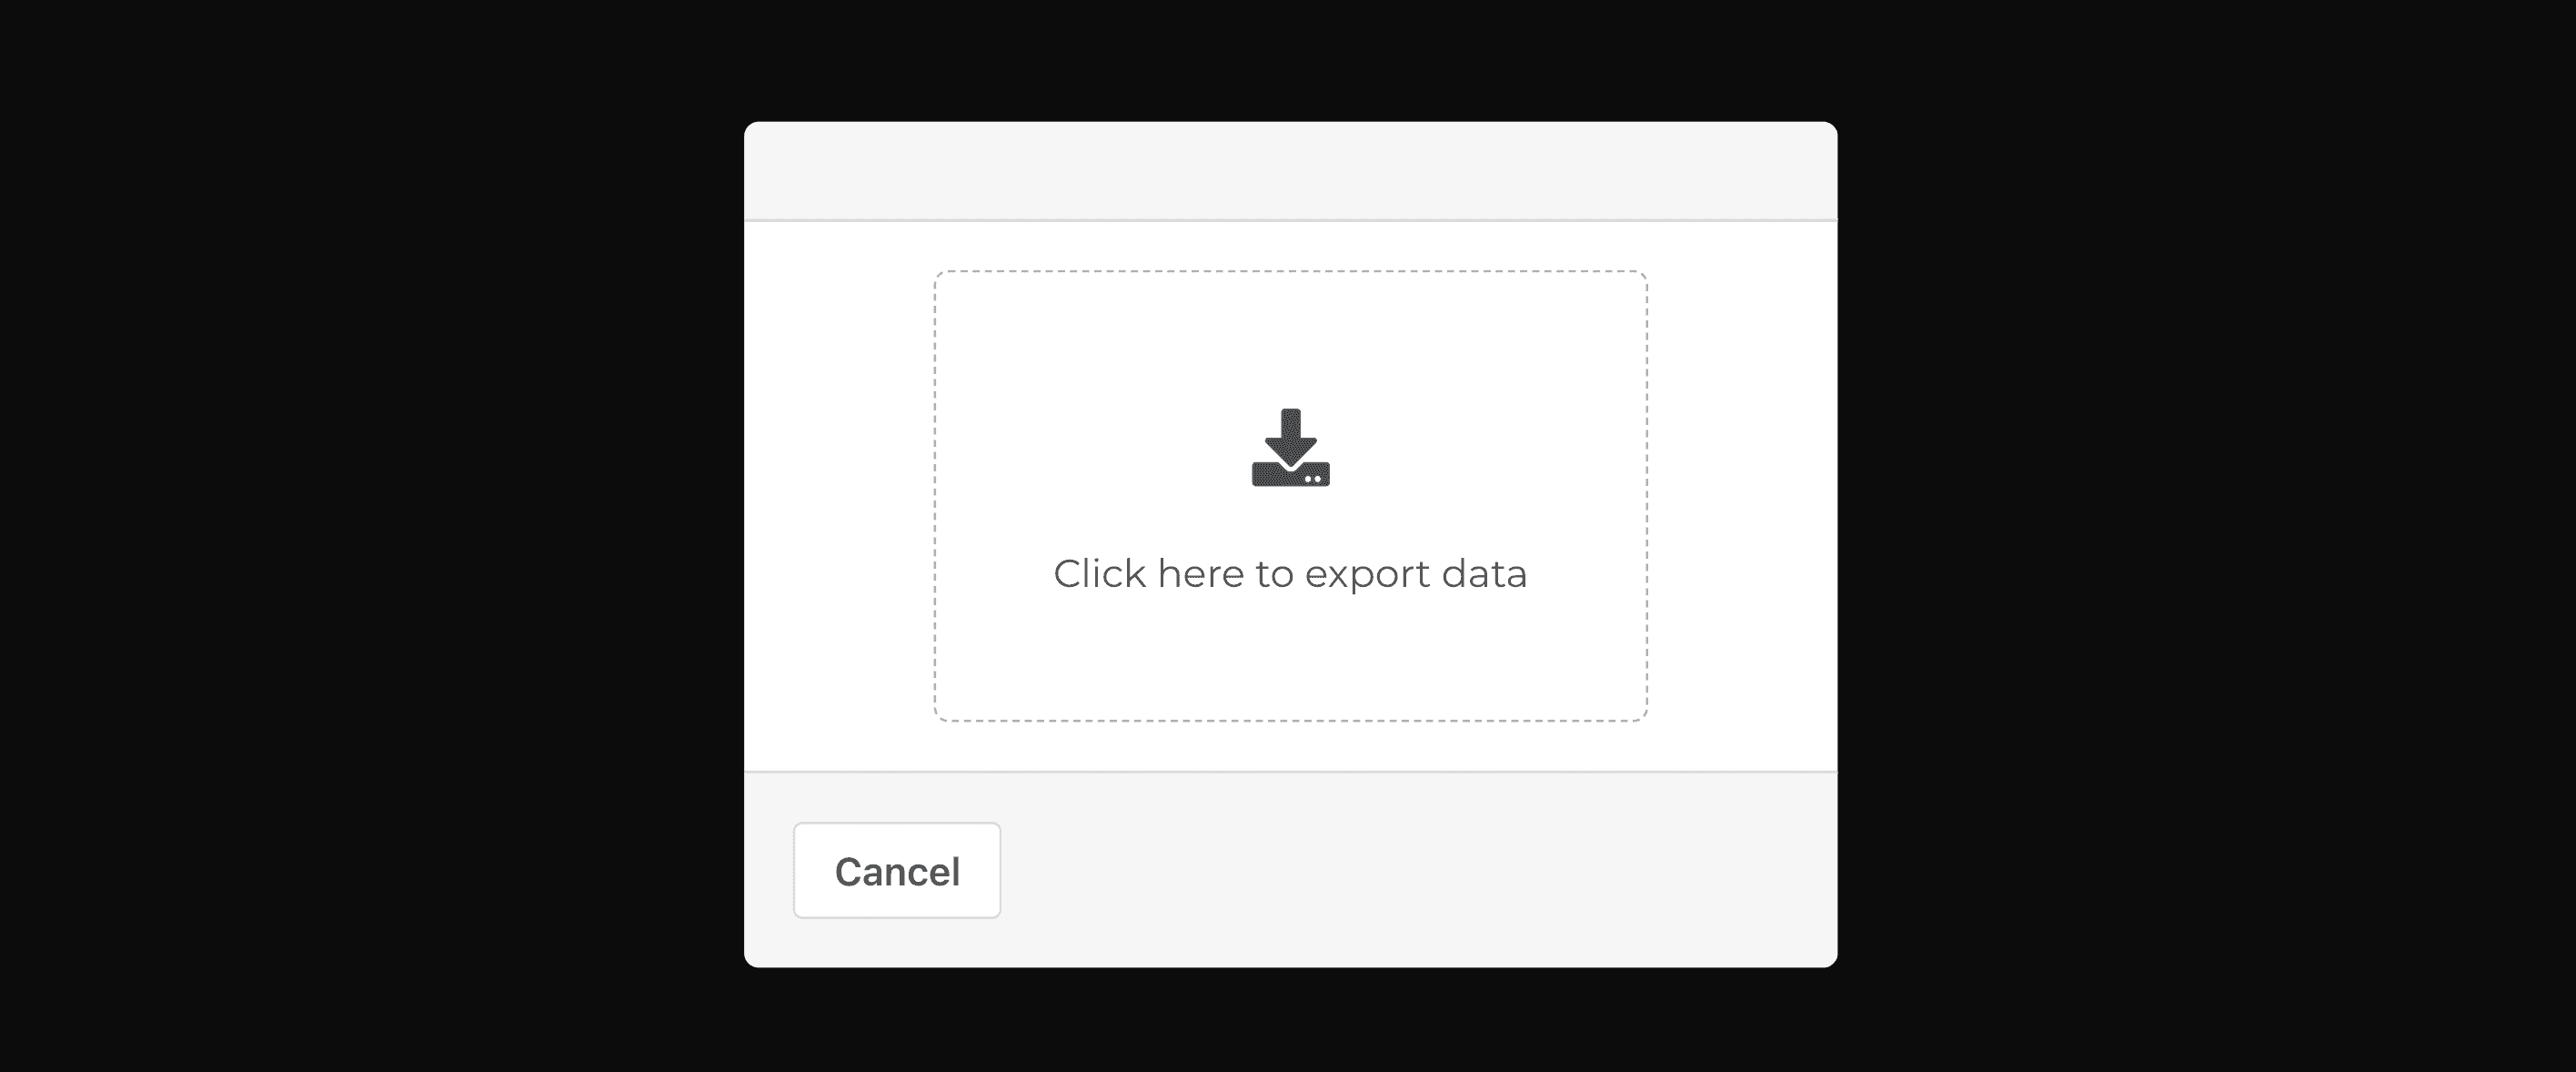
A modal opens that allows triggering the data export:
When you export data in CSV, you can import the exported CSV file into a spreadsheet tool such as Excel (Windows) or Numbers (Mac).
The timing metrics are represented in seconds. To convert them into minutes, hours, and days, use the following conversion:
1 minute = 60 seconds
1 hour = 3600 seconds
1 day = 86400 seconds
Export data from a click-through list
Screenful charts are clickable, and you can drill into the numbers in a chart.

For example, when you click a bar in a bar chart, you'll get a list of items that were used to calculate the value:
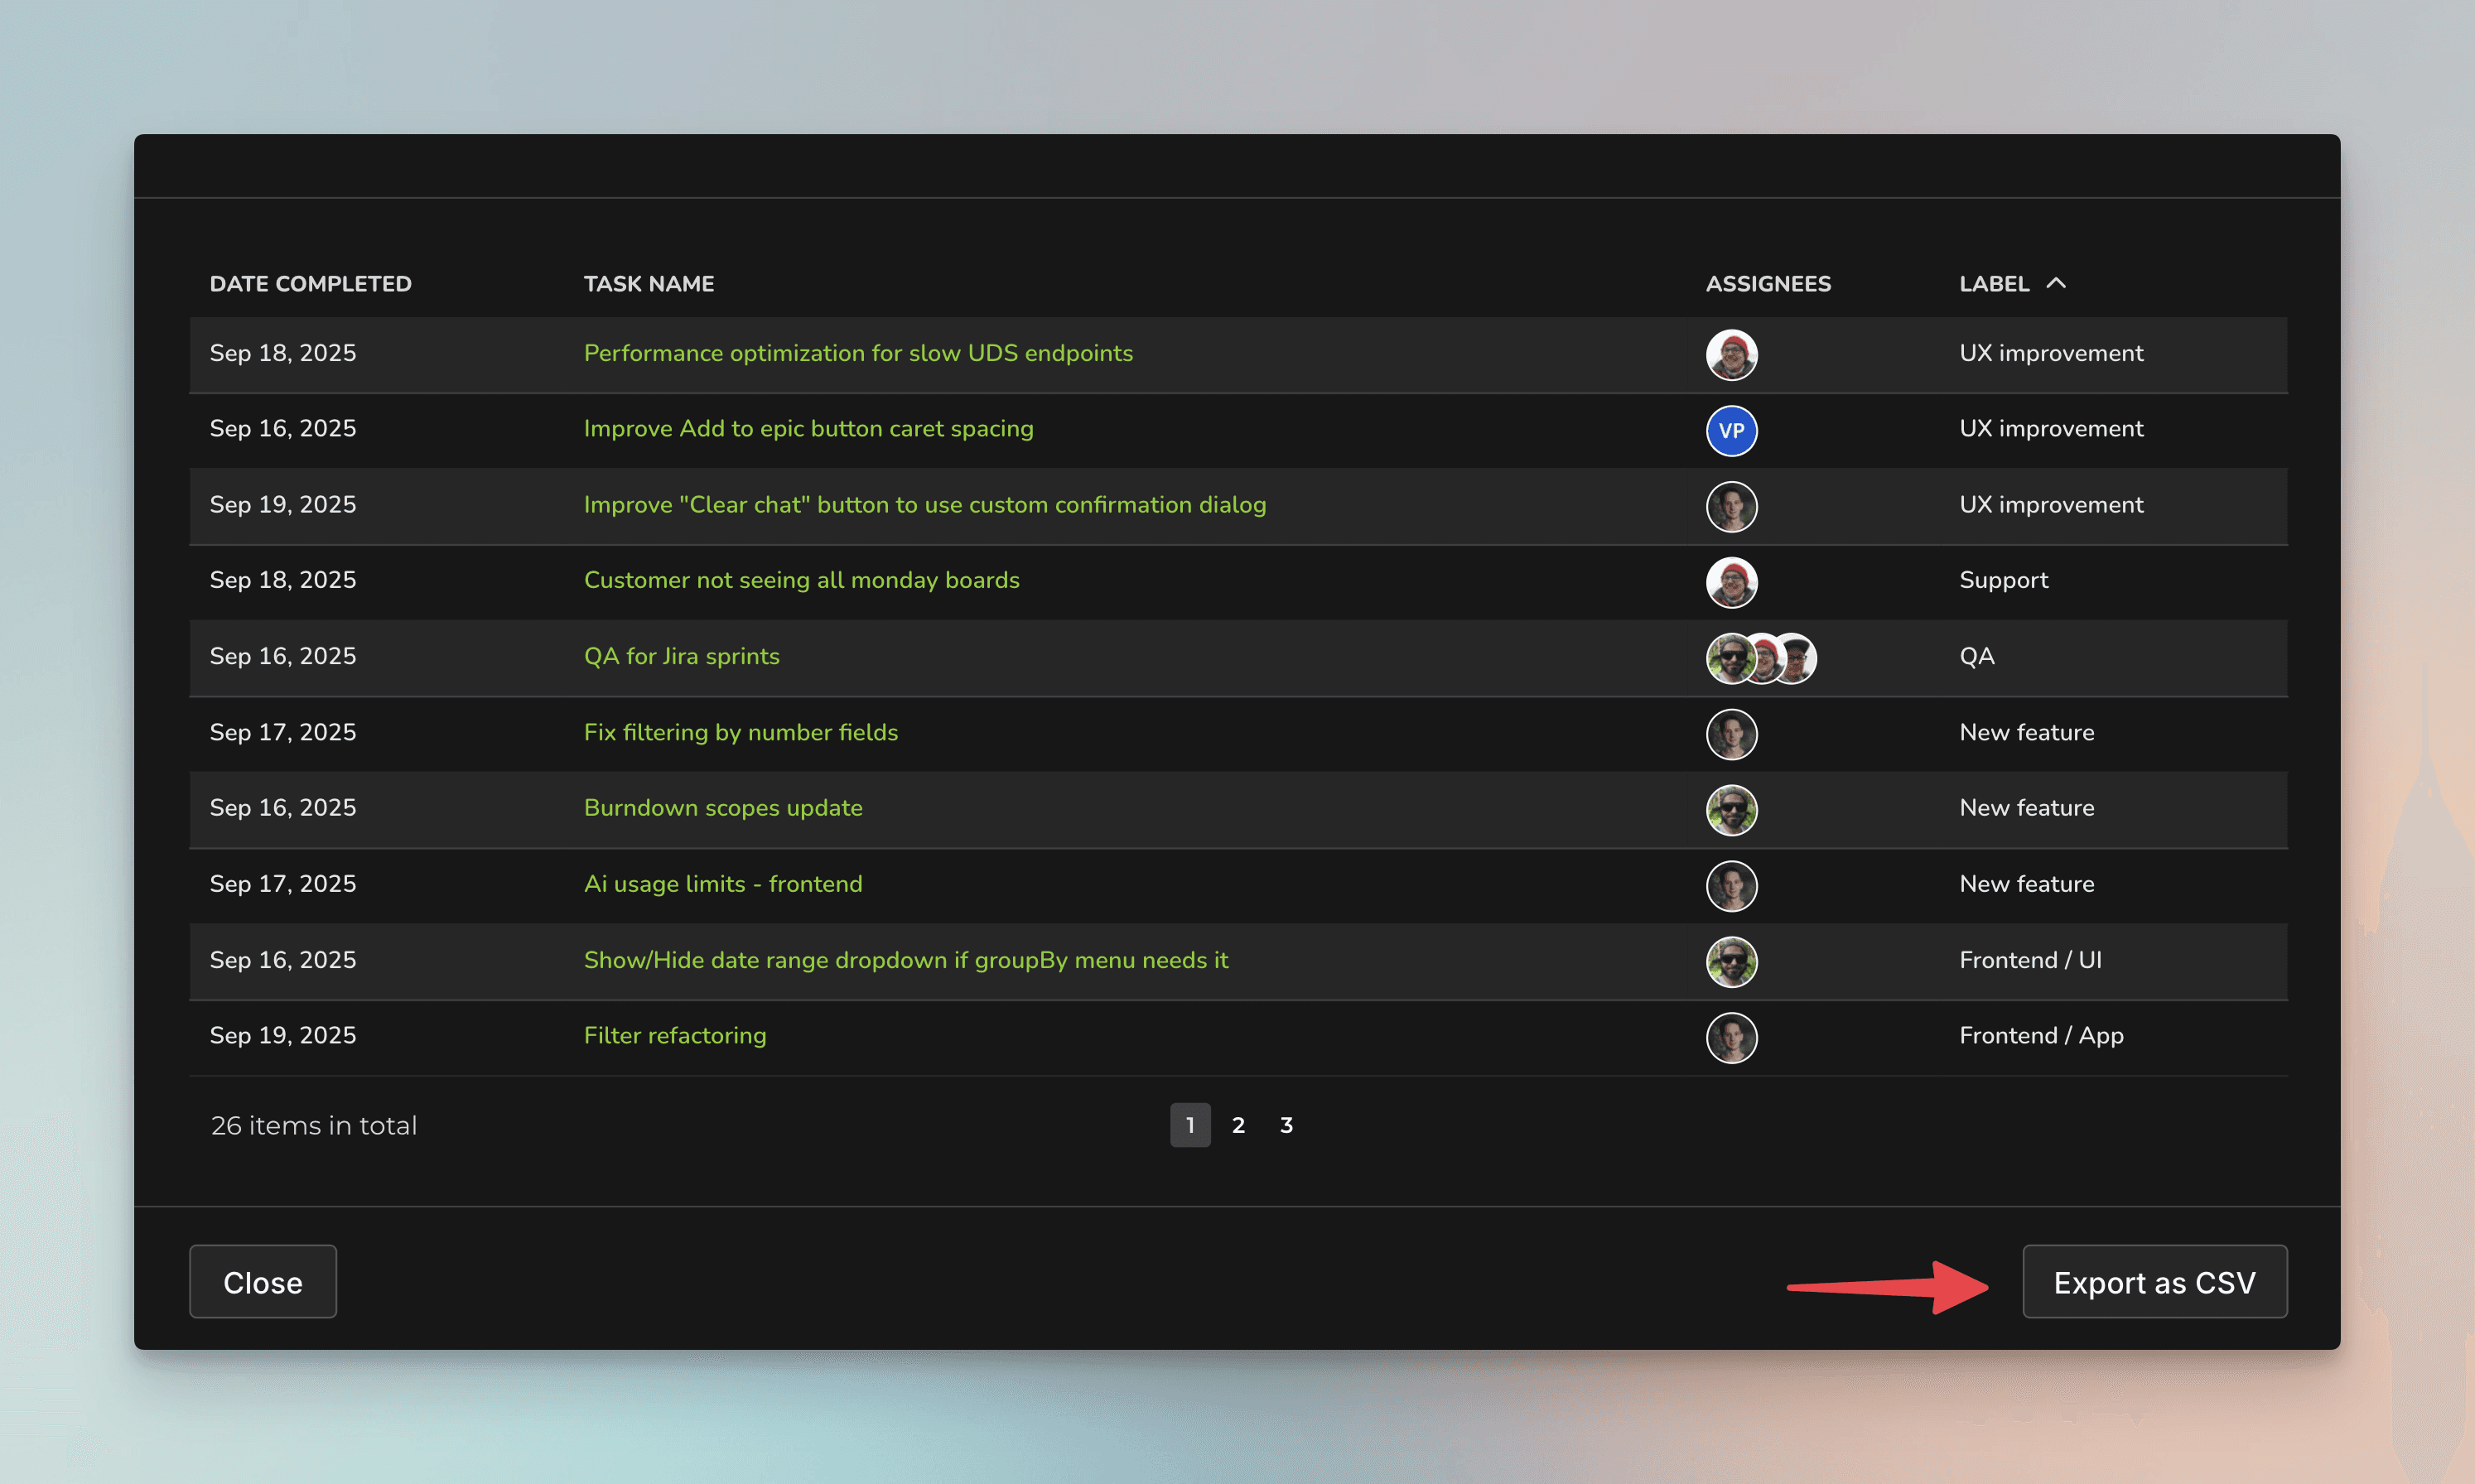
You can click the Export as CSV button at the bottom to export the list as CSV.
Download report as PDF
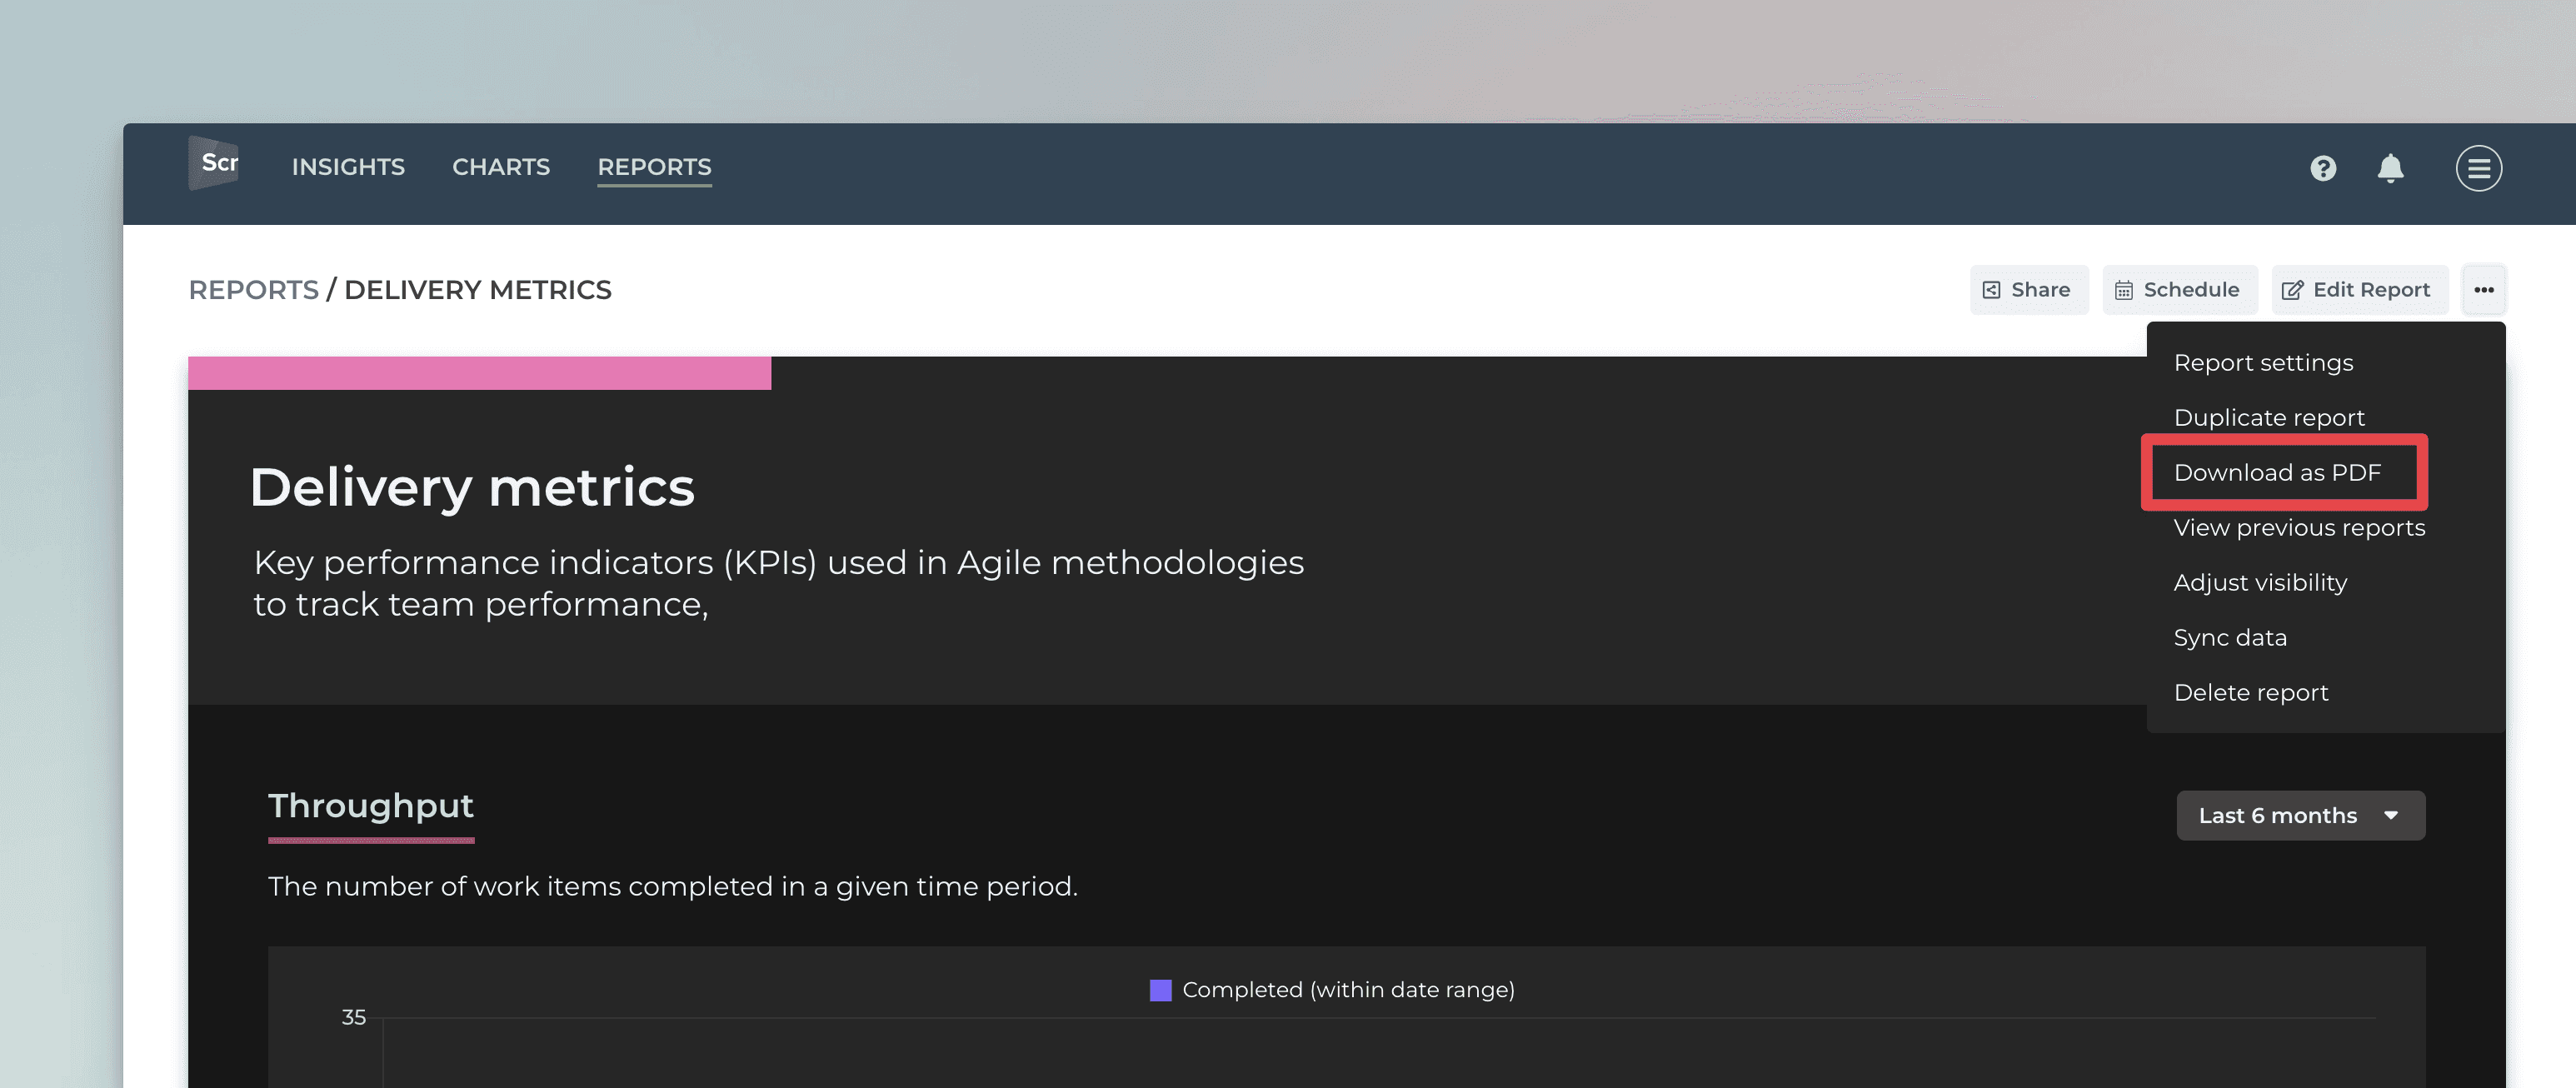
A Screenful report can contain multiple charts, so you can't export a report in a single CSV or JSON file. When viewing a report under the Reports tab, you can export it in PDF by clicking the three dots menu in the top right corner:
A modal opens with the text Generating PDF:
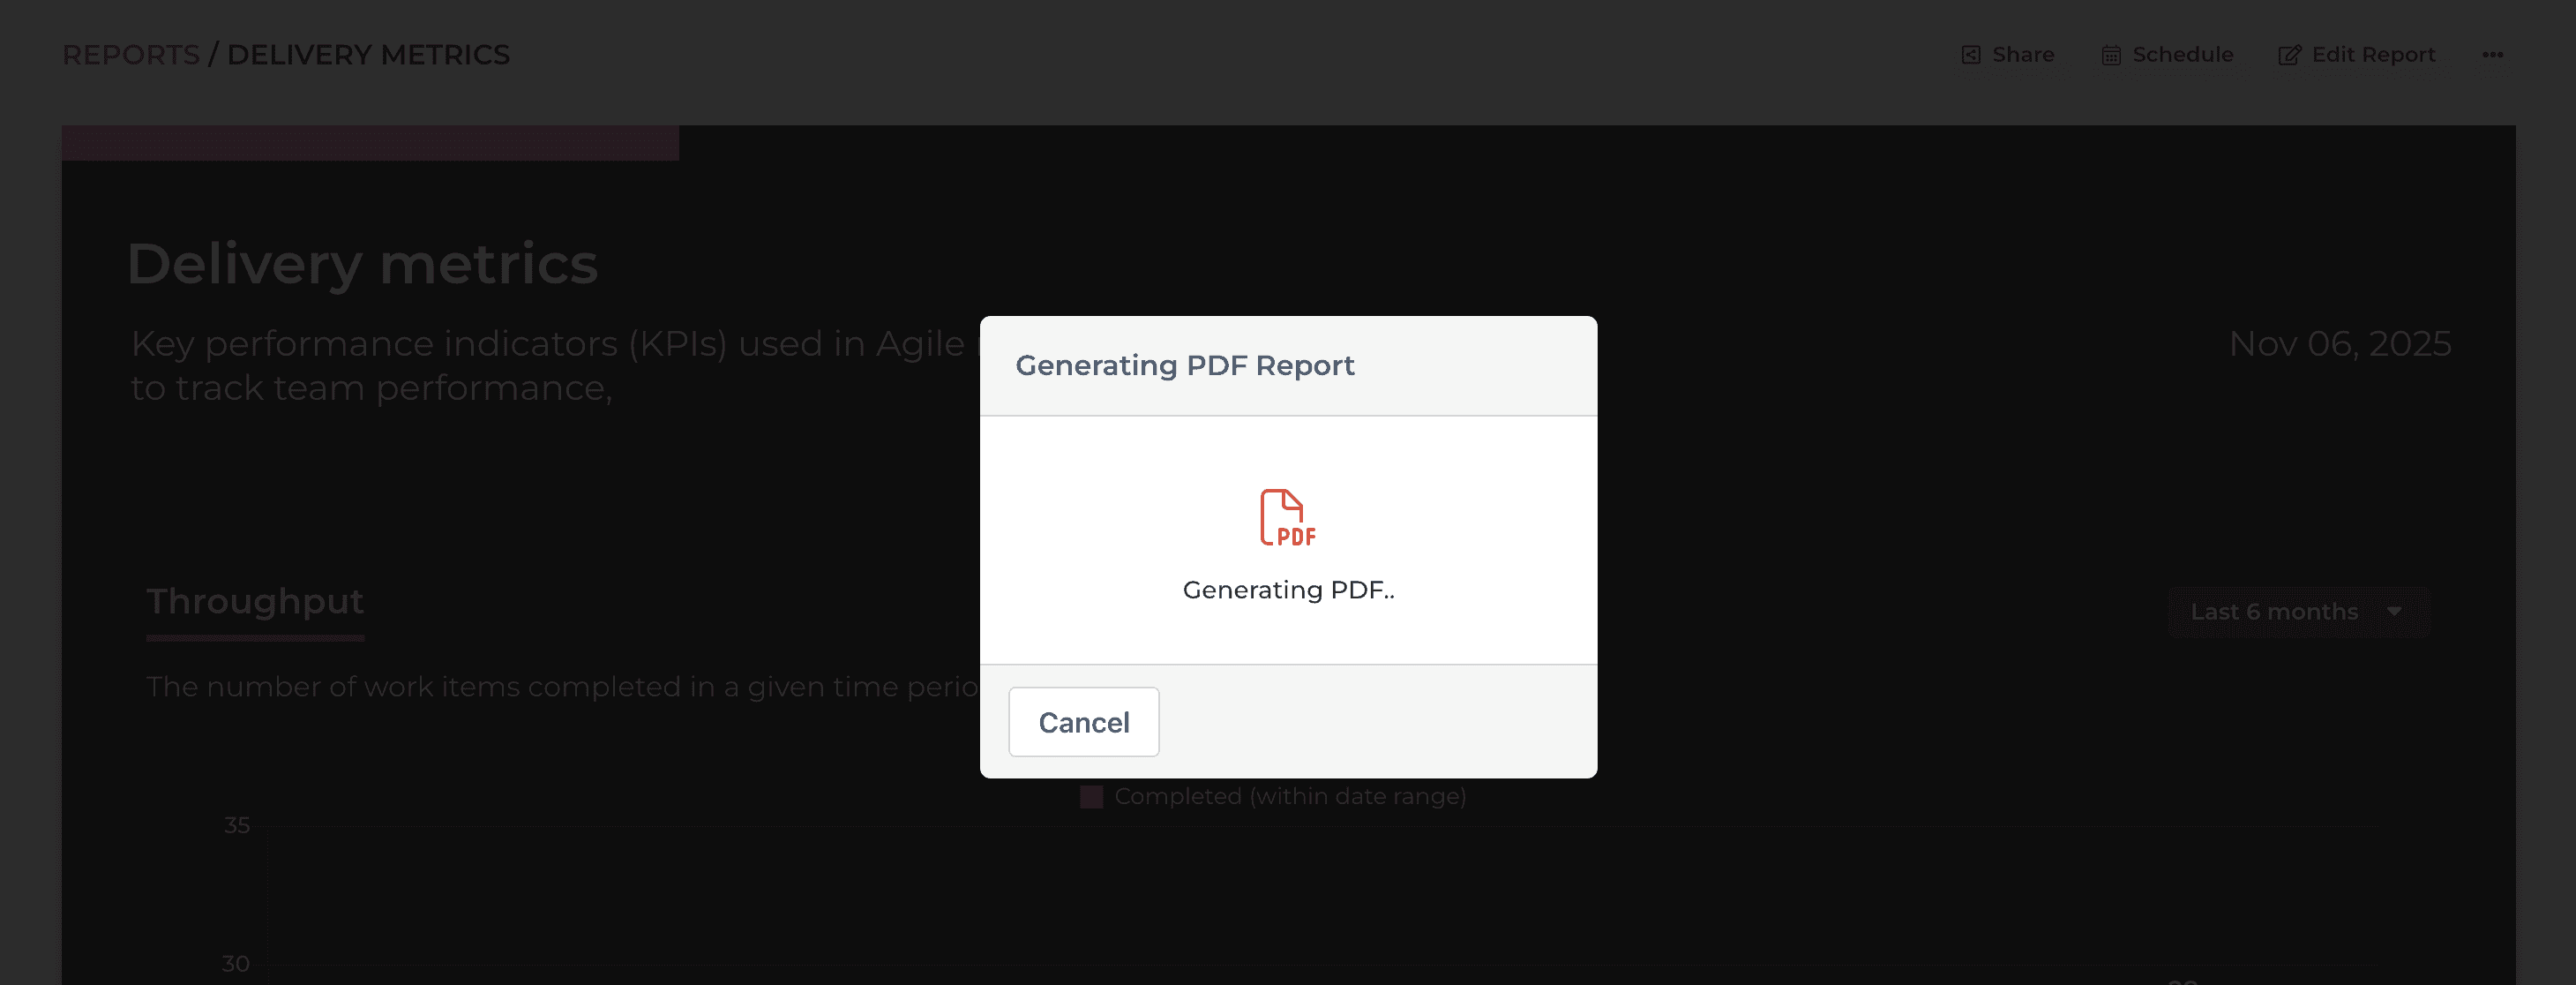
Once the PDF is generated, the download starts automatically.
Scheduling data exports to email
This feature is available only in the Scale and Enterprise plans
When scheduling a report to email or Slack, you can select the format to be PDF or CSV:
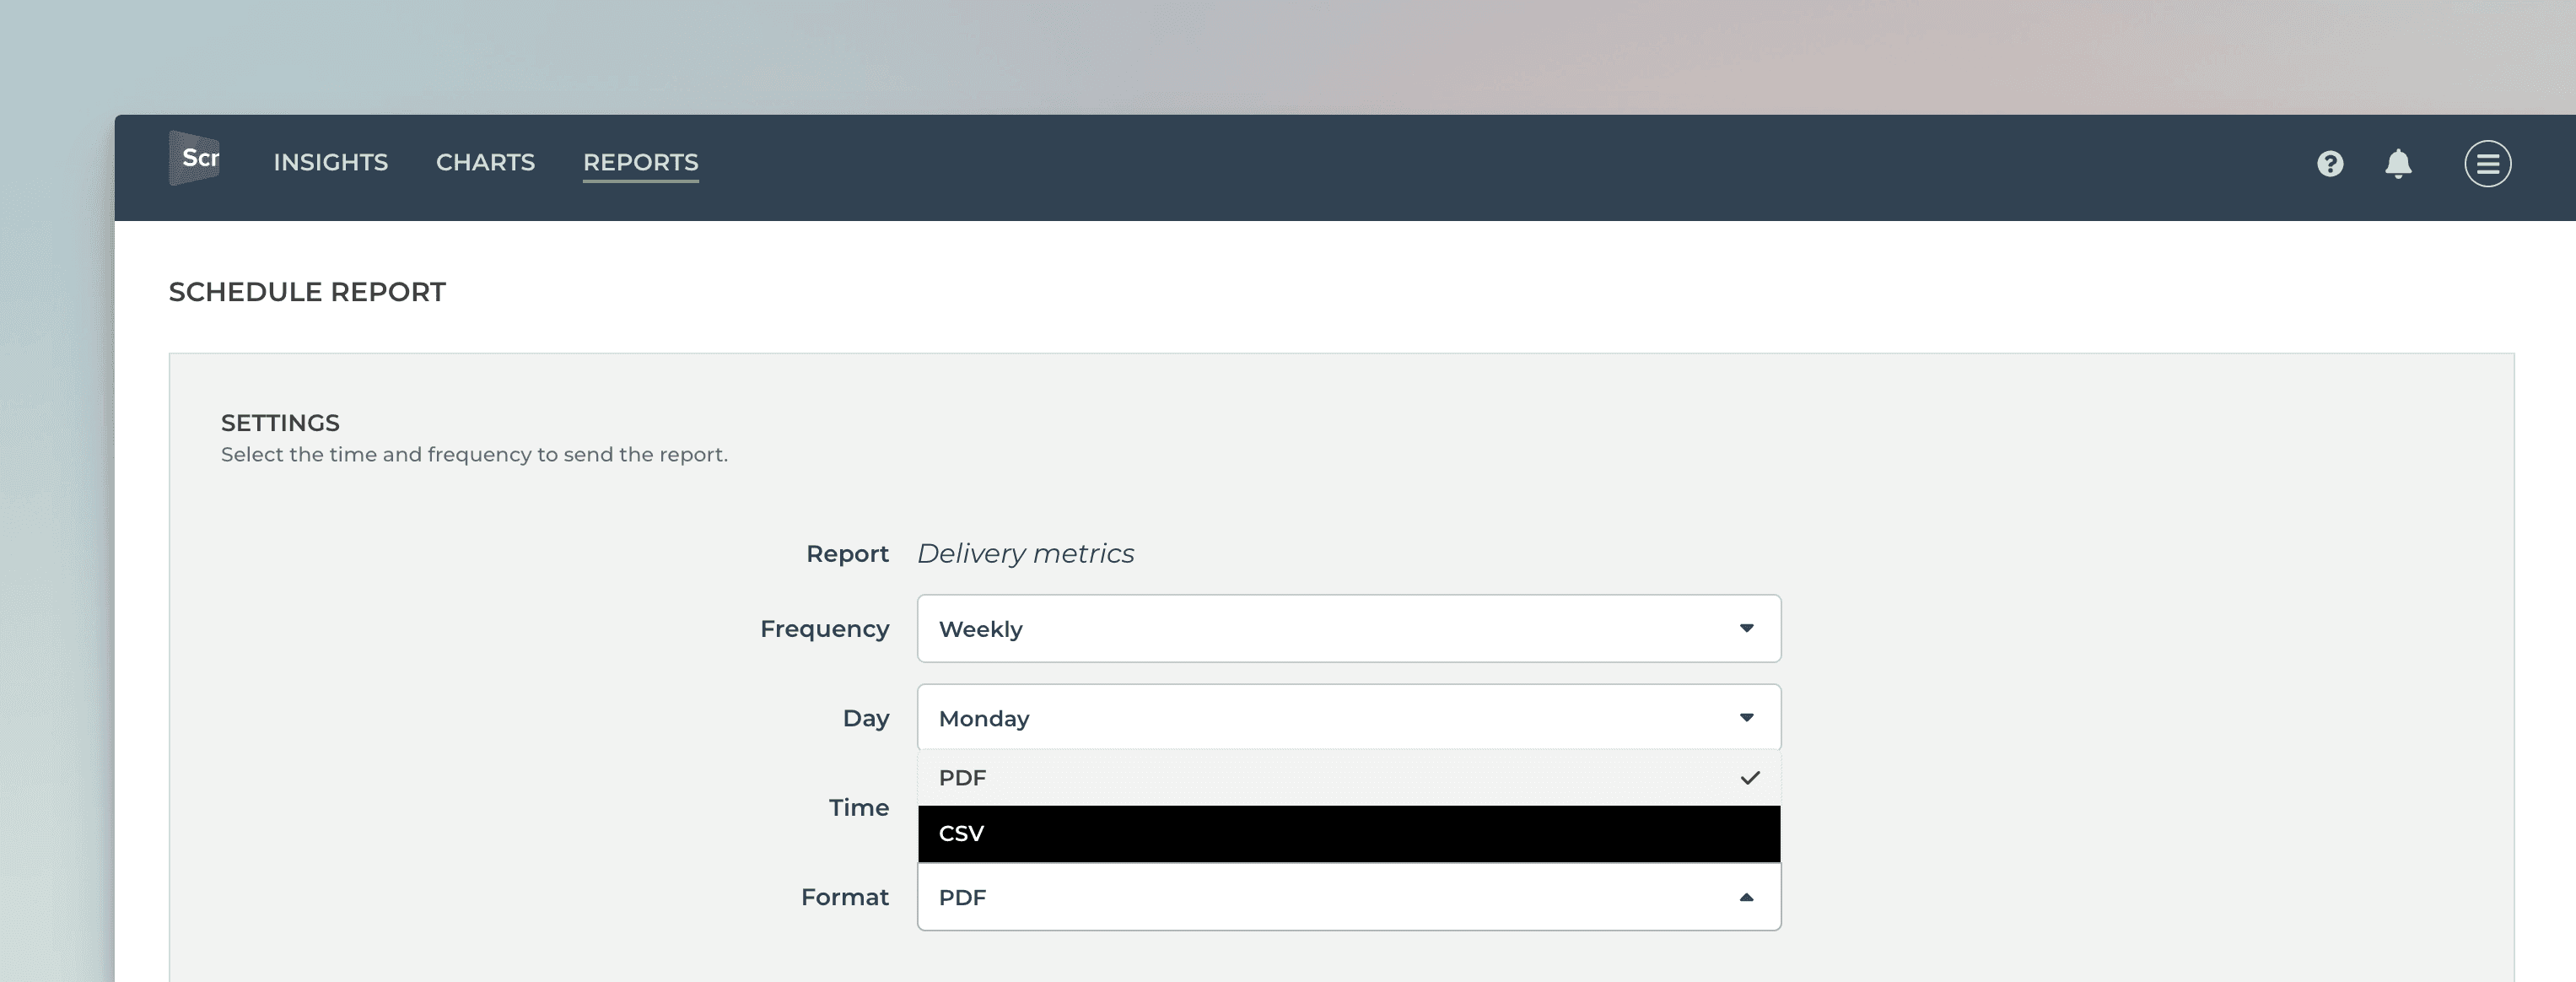
When CSV is selected, all chats in the report are exported to CSV, and the resulting files are attached to the scheduled email.
Learn more
Book a free onboarding call
Need help with setting up your charts and reports? Don't find a metric you are looking for? Book a call with our expert. We'd love to help you supercharge your reporting!


