Line chart with dual axis
Plot two different units in one chart with the Dual Axis Line chart. Pick one metric on the left axis and another on the right axis, and see the trends over the selected time period.

Track trends with the dual axis line chart
Plot two different units in one chart with the Dual Axis Line chart. Pick one metric on the left axis and another on the right axis and ee the trends over the selected time period. You can pick multiple metrics for both axes. This chart can be used for comparing the trends of two different units (e.g. tasks vs time).

Use advanced filters to select the items for the chart
You can filter by any property, such as task type (bug, user story, new feature), assignee, label, or epic.
You can set comparison filters by any of your number fields or date fields, or filter by keywords with an exact or partial match.
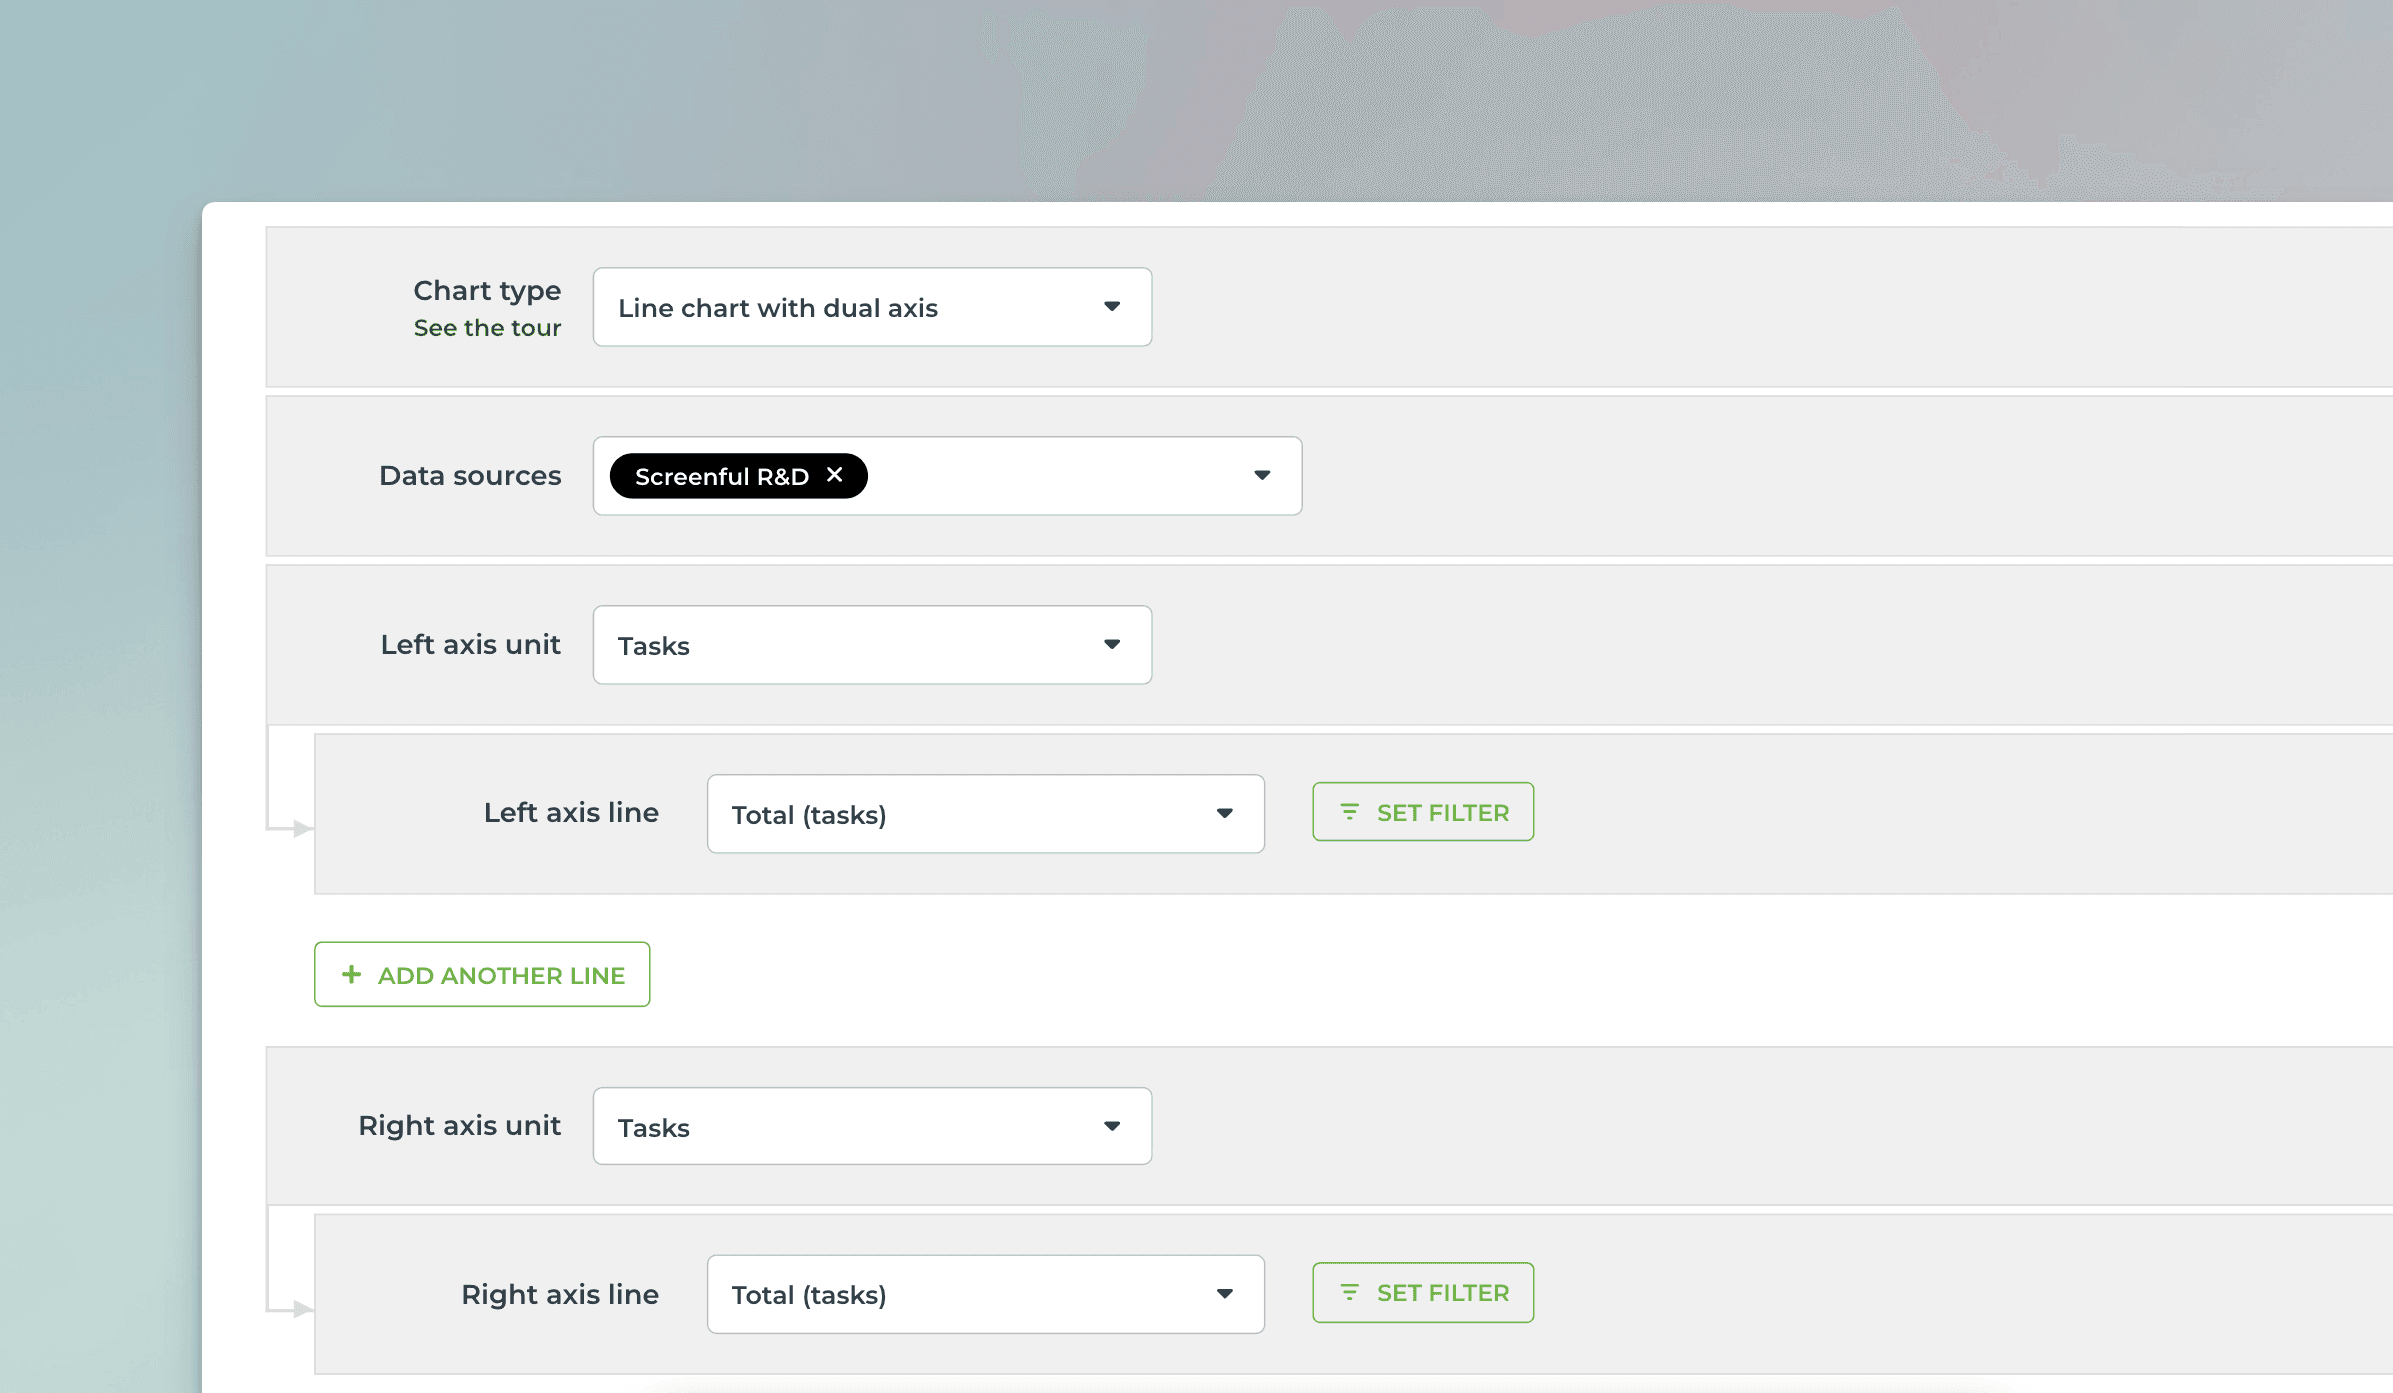
Create from template and customize
You can create this chart with just a few clicks using a template. Customize it to your liking with the chart editor.
Compare multiple metrics on two axes
Use data from any of your custom fields
Rename labels to your liking
Set the format of the numbers (currency, number format)
Select light mode or dark mode
Export to CSV or JSON


