Get started with Analytics & Reports by Screenful
Get started with Analytics & Reports by Screenful

Step 1: Create a Screenful account or log in
After you’ve installed the app via the Monday Marketplace, the Analytics & Reports by Screenful is added to the left menu. When you click it, you'll be shown a login screen (unless you are already logged in).

If you do not have a Screenful account, you can sign up for a new trial, or request an invitation if your organization already has an account.
Learn more about Setting up Screenful for monday.com
Step 2: Import data sources
You need to authorize Screenful to access the Monday API to get started. Once done, you will be shown a list of boards. Select one or more boards from the list to import into Screenful.
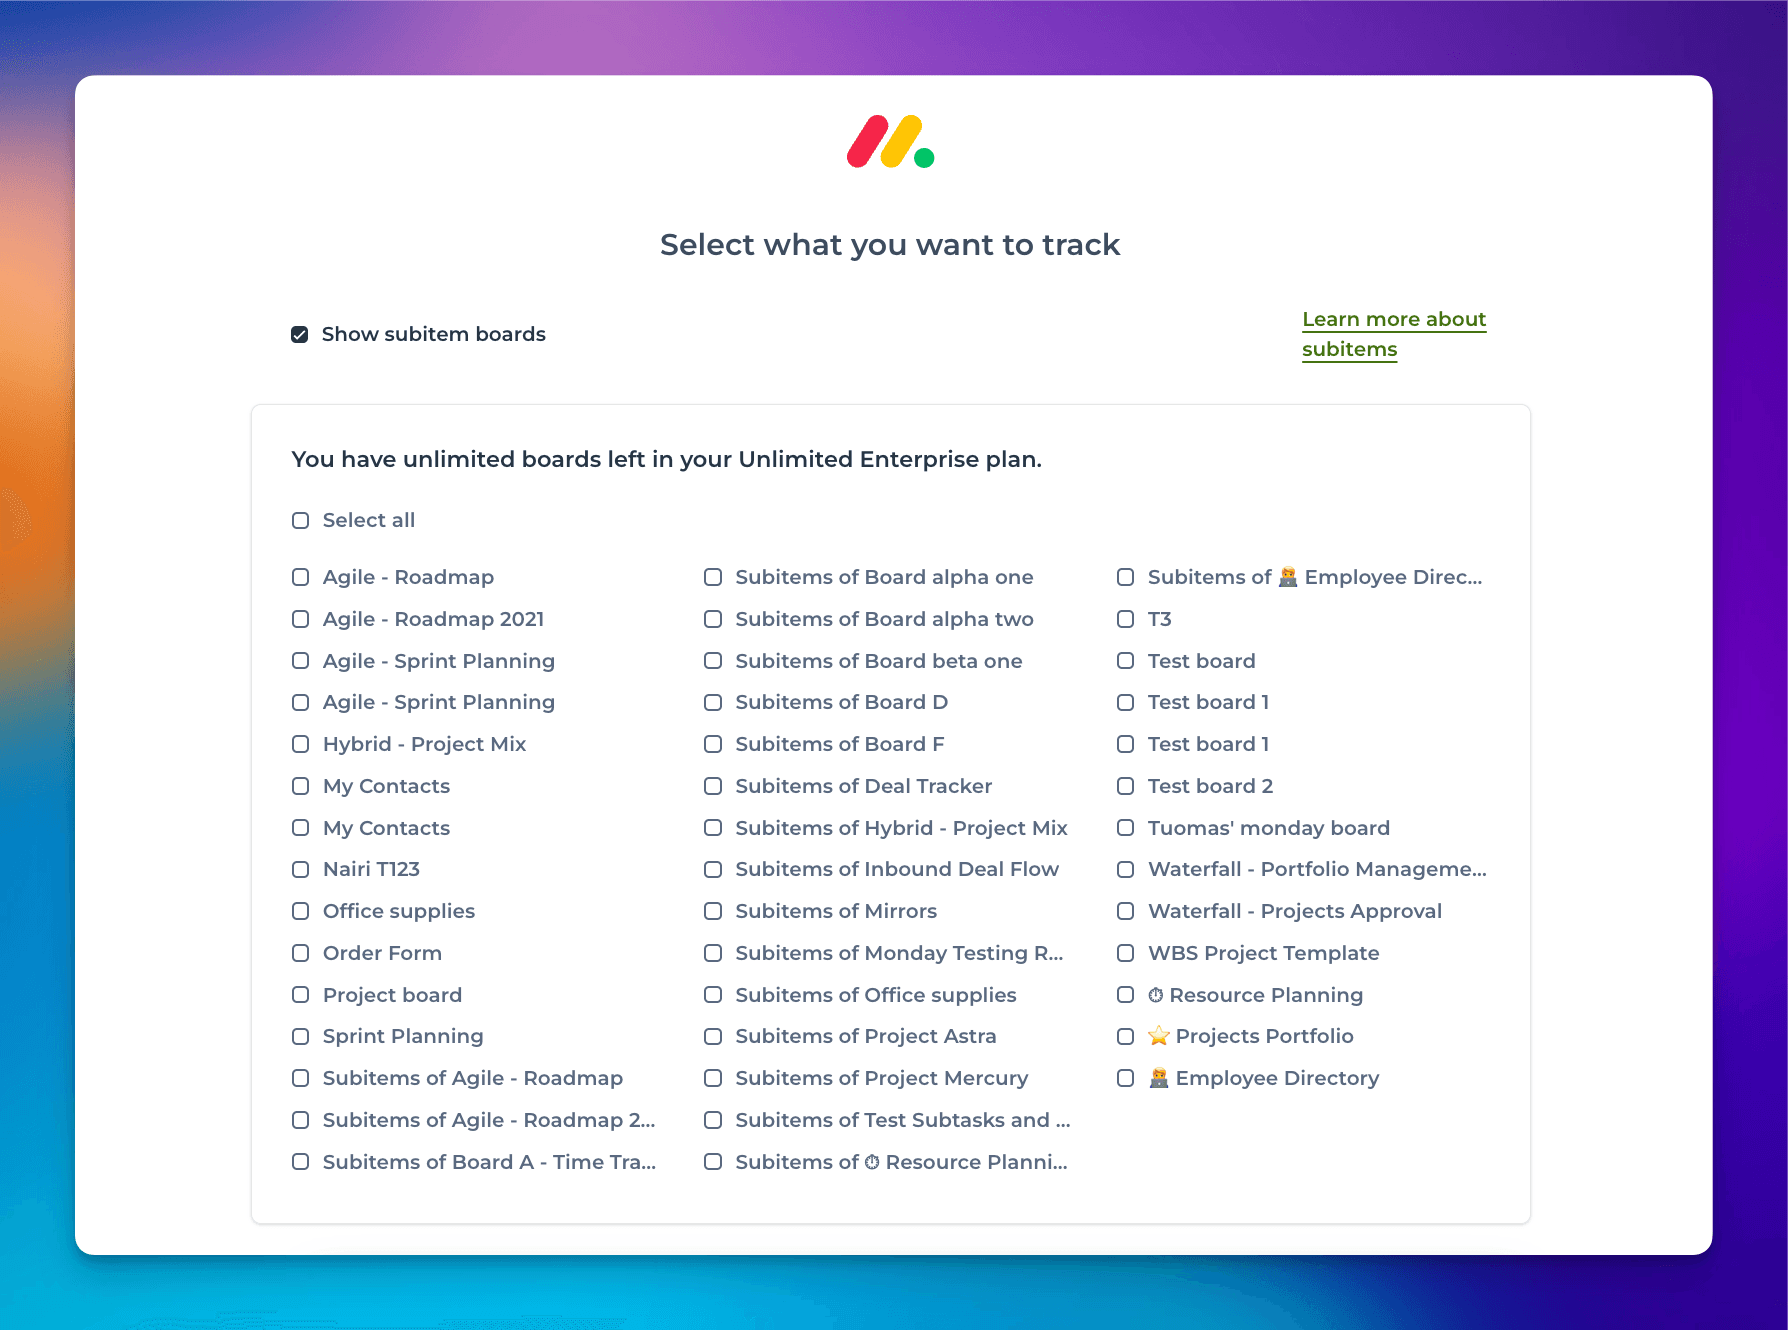
Once you have selected the boards for importing, you can use them as data sources in your charts.
Step 3: Create your first custom chart
To create a custom chart
Navigate to the Charts tab
Click Add new chart in the top right corner
A modal is opened with a set of chart templates. You can either create a new chart from scratch or pick one of the predefined charts.
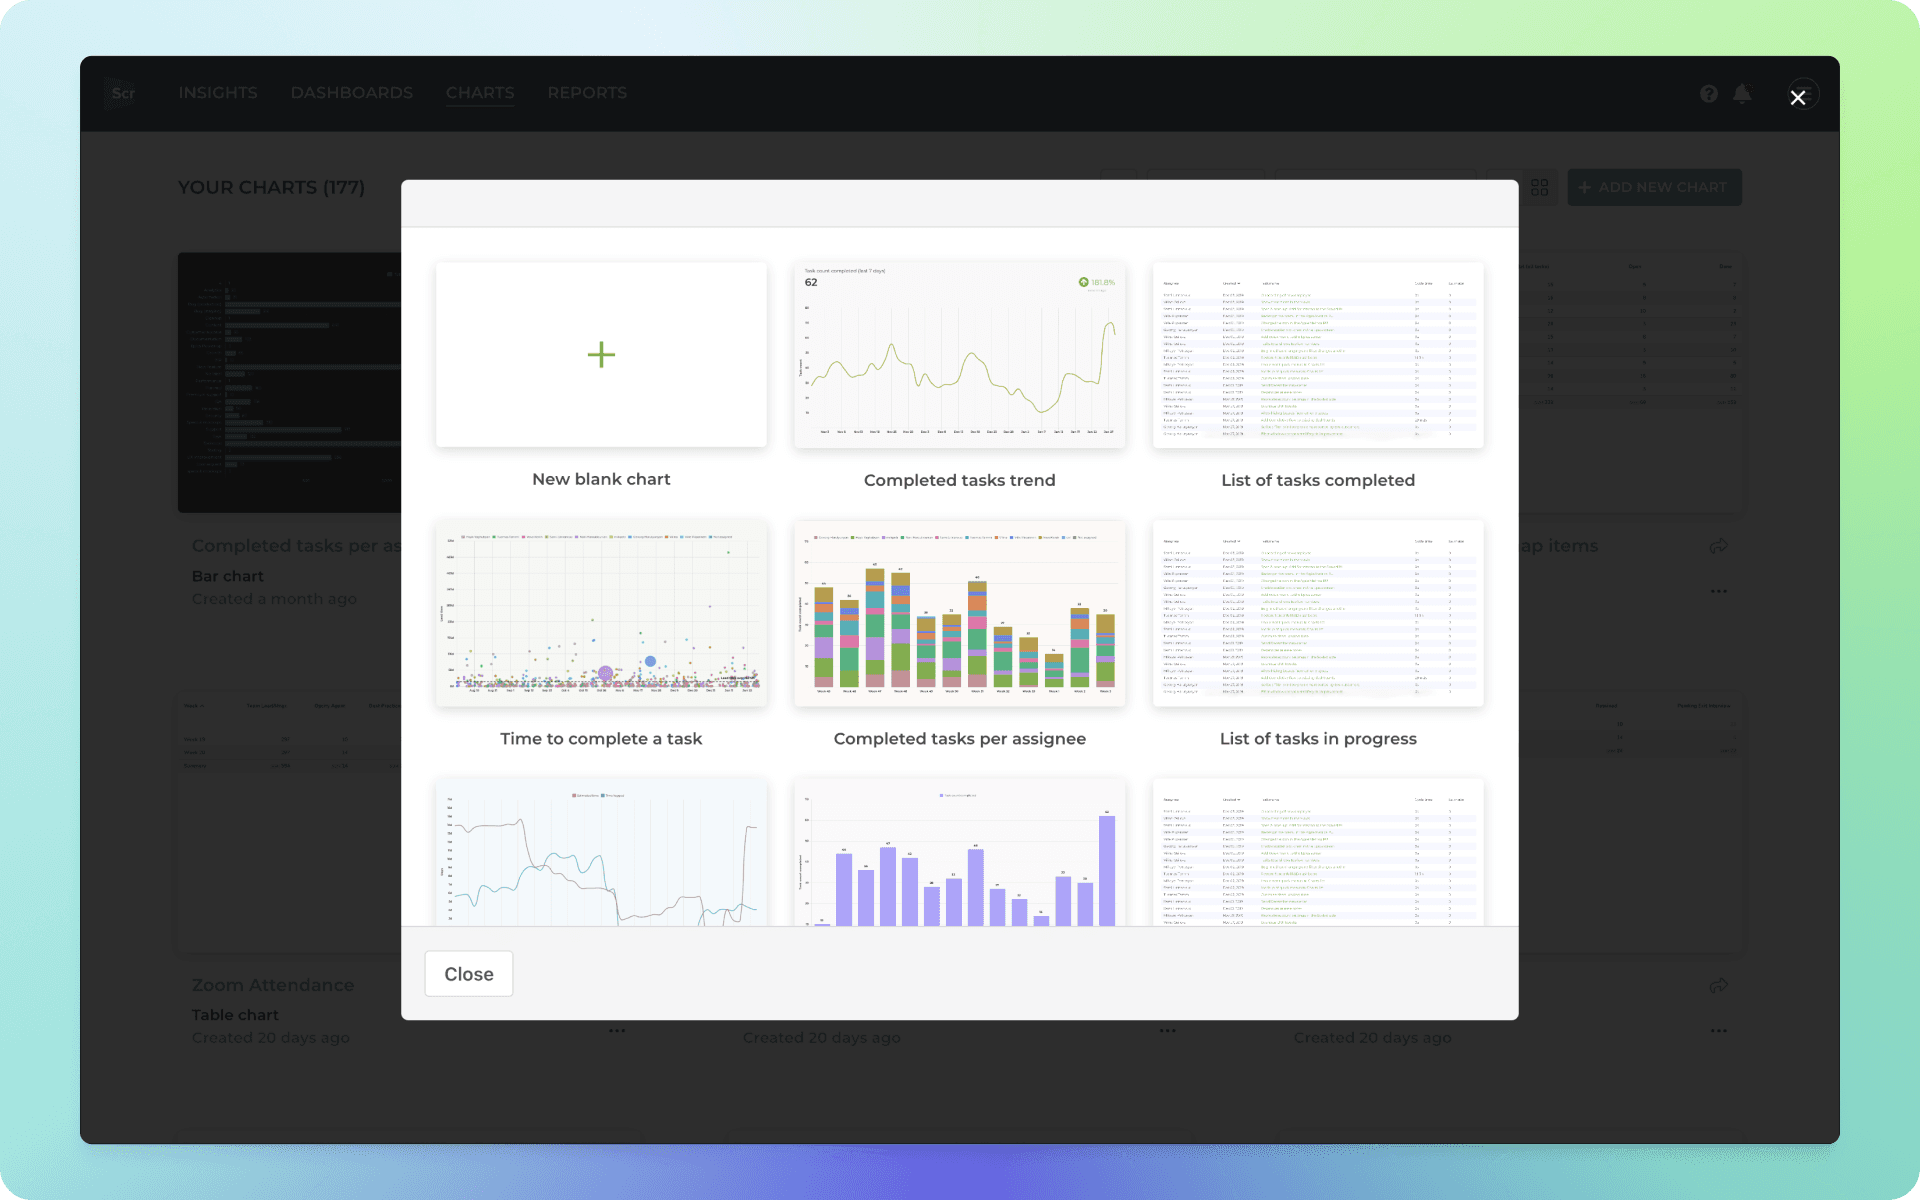
Clicking one of chart templates opens a preview with real data. You can select the data sources from the Data source menu above the chart. You can pick one or more data sources for your chart and see the results immediately.
Learn more about creating custom charts for Monday.
Step 4: Invite your team
With Screenful, you can invite an unlimited number of users for free. To invite new users, go to Account Settings in the main menu and open the Manage Users tab. There, you will see a list of users and their roles.
Click Invite user on the bottom left to invite a new user. Enter the email address to send an invitation email. There are two different user roles available:
Admin - Can change settings, manage users, plans & billing
Member - Can change settings and invite new users
Observer - Can only view data, and cannot change any settings
The invited user will receive an invitation email.
Learn more about inviting users to Screenful
Step 4: Explore more features
You can learn more about Screenful from the Getting Started guide.
Step 1: Create a Screenful account or log in
After you’ve installed the app via the Monday Marketplace, the Analytics & Reports by Screenful is added to the left menu. When you click it, you'll be shown a login screen (unless you are already logged in).
If you do not have a Screenful account, you can sign up for a new trial, or request an invitation if your organization already has an account.
Learn more about Setting up Screenful for monday.com
Step 2: Import data sources
You need to authorize Screenful to access the Monday API to get started. Once done, you will be shown a list of boards. Select one or more boards from the list to import into Screenful.
Once you have selected the boards for importing, you can use them as data sources in your charts.
Step 3: Create your first custom chart
To create a custom chart
Navigate to the Charts tab
Click Add new chart in the top right corner
A modal is opened with a set of chart templates. You can either create a new chart from scratch or pick one of the predefined charts.
Clicking one of chart templates opens a preview with real data. You can select the data sources from the Data source menu above the chart. You can pick one or more data sources for your chart and see the results immediately.
Learn more about creating custom charts for Monday.
Step 4: Invite your team
With Screenful, you can invite an unlimited number of users for free. To invite new users, go to Account Settings in the main menu and open the Manage Users tab. There, you will see a list of users and their roles.
Click Invite user on the bottom left to invite a new user. Enter the email address to send an invitation email. There are two different user roles available:
Admin - Can change settings, manage users, plans & billing
Member - Can change settings and invite new users
Observer - Can only view data, and cannot change any settings
The invited user will receive an invitation email.
Learn more about inviting users to Screenful
Step 4: Explore more features
You can learn more about Screenful from the Getting Started guide.
Book a free onboarding call
Need help with setting up your charts and reports? Don't find a metric you are looking for? Book a call with our expert. We'd love to help you supercharge your reporting!