

Empower your R&D with automated analytics
Get data-driven insights to deliver projects on time
Screenful helps engineering leaders to optimize their software delivery so they can build the right things faster. Gain visibility across your engineering organization to improve predictability, reduce costs, and increase customer satisfaction.
Features
Data to drive decisions at every level


"Really good looking views and easy setup. Ideal for providing open visibility for the progress across the company."
complete toolkit
Zero to value in minutes
Streamline your reporting process with Screenful. Say goodbye to manual busywork so you can focus on delivering value.

FAQ
Common questions
By default, charts and reports are public. You can set them to private in the settings (behind the three dots menu).
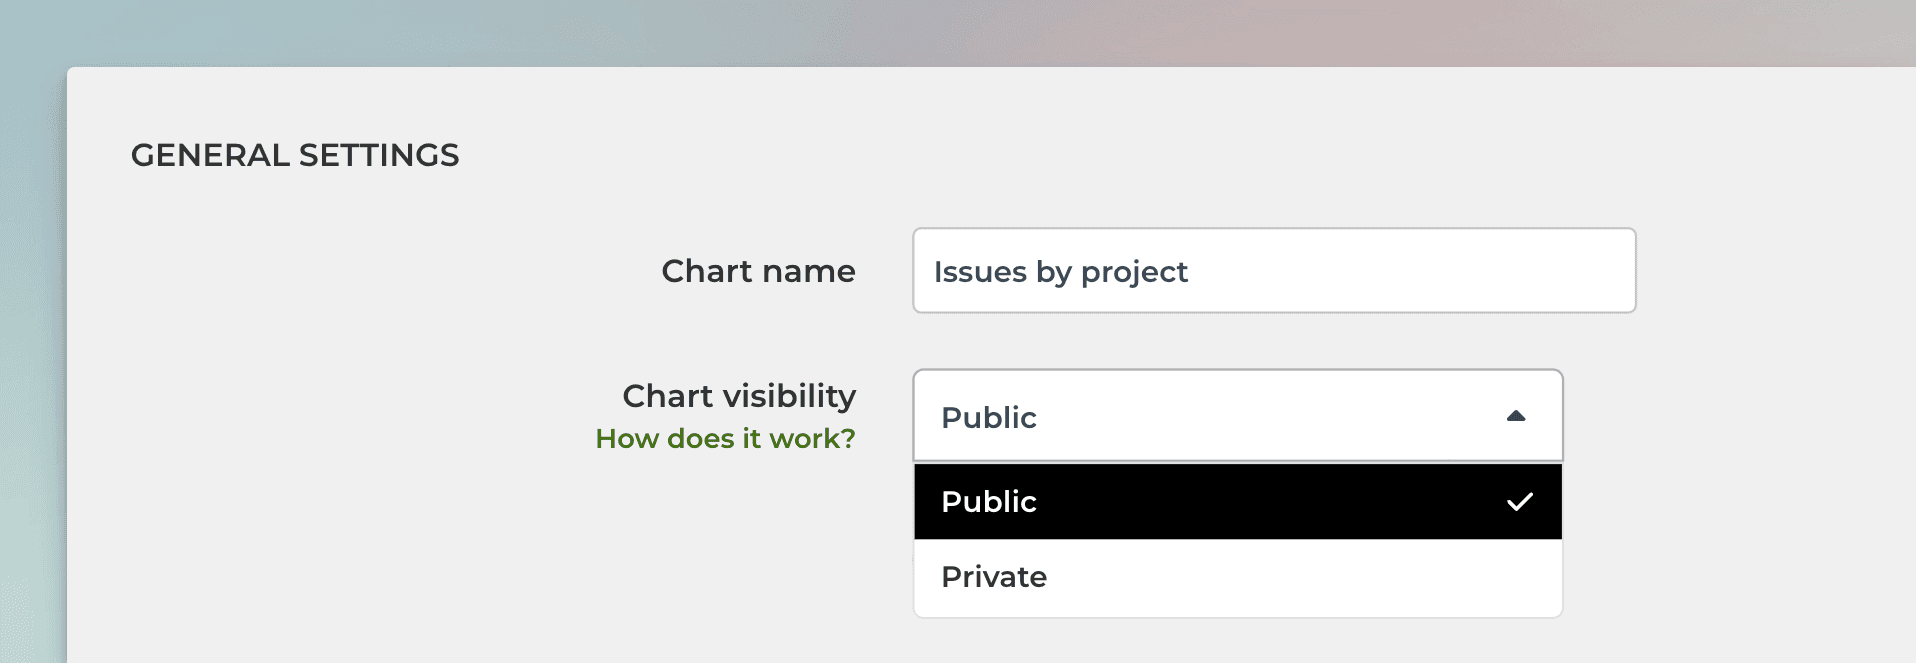
Here's what these settings mean:
If a chart is set to public, it appears in the Charts tab for all users in your account. Anyone in the account can edit the chart or add it to a report.
If a chart is set to private, it appears only to you in the Charts tab. Other users in your account cannot view it. You can still add the chart to a report. When you do, the chart becomes visible to anyone who has access to that report.
If a report is set to public, it is visible under the Reports tab to all users in your account. Anyone in your account can edit or schedule that report.
If a report is set to private, it is visible only to you in the Reports tab. Other people in your account won’t be able to edit or schedule that report. You can still schedule the report to be sent via email or Slack, and when you do so, the recipients can see the PDF version of the report. However, they cannot access the online version of that report since it is private.
By default, charts and reports are public. You can set them to private in the settings (behind the three dots menu).
Here's what these settings mean:
If a chart is set to public, it appears in the Charts tab for all users in your account. Anyone in the account can edit the chart or add it to a report.
If a chart is set to private, it appears only to you in the Charts tab. Other users in your account cannot view it. You can still add the chart to a report. When you do, the chart becomes visible to anyone who has access to that report.
If a report is set to public, it is visible under the Reports tab to all users in your account. Anyone in your account can edit or schedule that report.
If a report is set to private, it is visible only to you in the Reports tab. Other people in your account won’t be able to edit or schedule that report. You can still schedule the report to be sent via email or Slack, and when you do so, the recipients can see the PDF version of the report. However, they cannot access the online version of that report since it is private.
You can manage the subscription in the billing settings. The location of the billing settings depends on the product you are subscribed to. You can learn more by following the instructions in this guide.
You can manage the subscription in the billing settings. The location of the billing settings depends on the product you are subscribed to. You can learn more by following the instructions in this guide.
We do not make changes to your data. We only read it via the API of your tool. Screenful is only for reporting and analytics. It does not update any data within your tools.
We do not make changes to your data. We only read it via the API of your tool. Screenful is only for reporting and analytics. It does not update any data within your tools.
All data sources are synced automatically once per hour. Changing settings or configuration will trigger additional sync so your data is at most one hour old. You can sync data manually at any time in the sync settings:
You'll see a list of current integrations, and you can trigger a sync by clicking the sync icon:
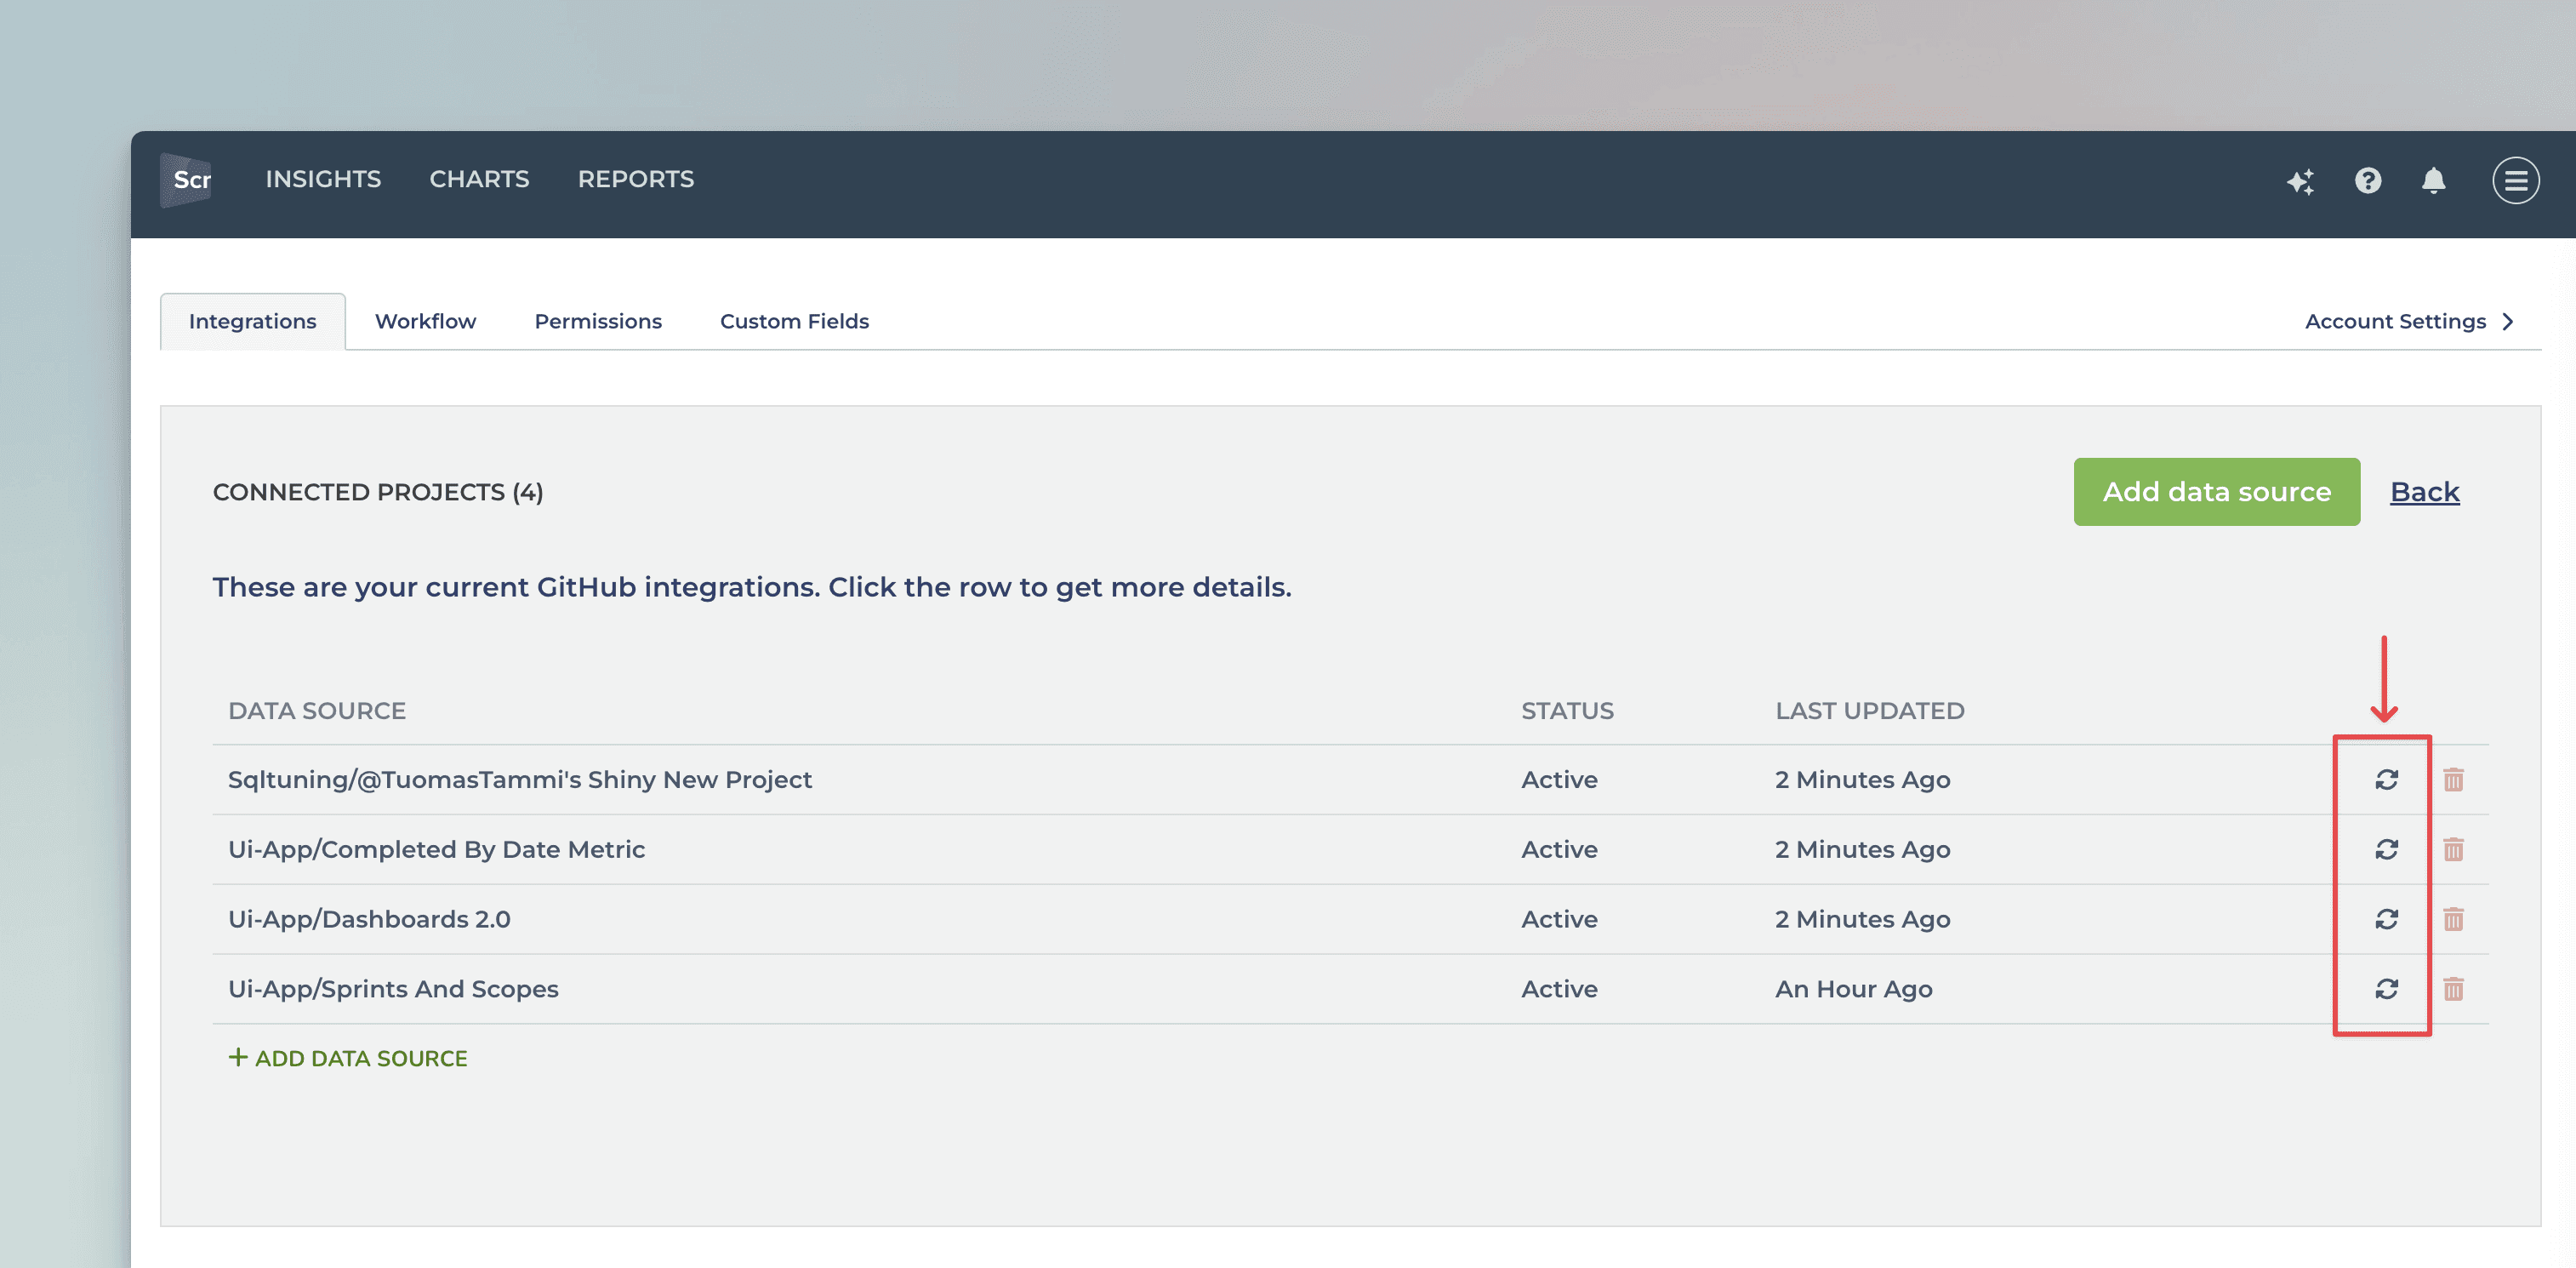
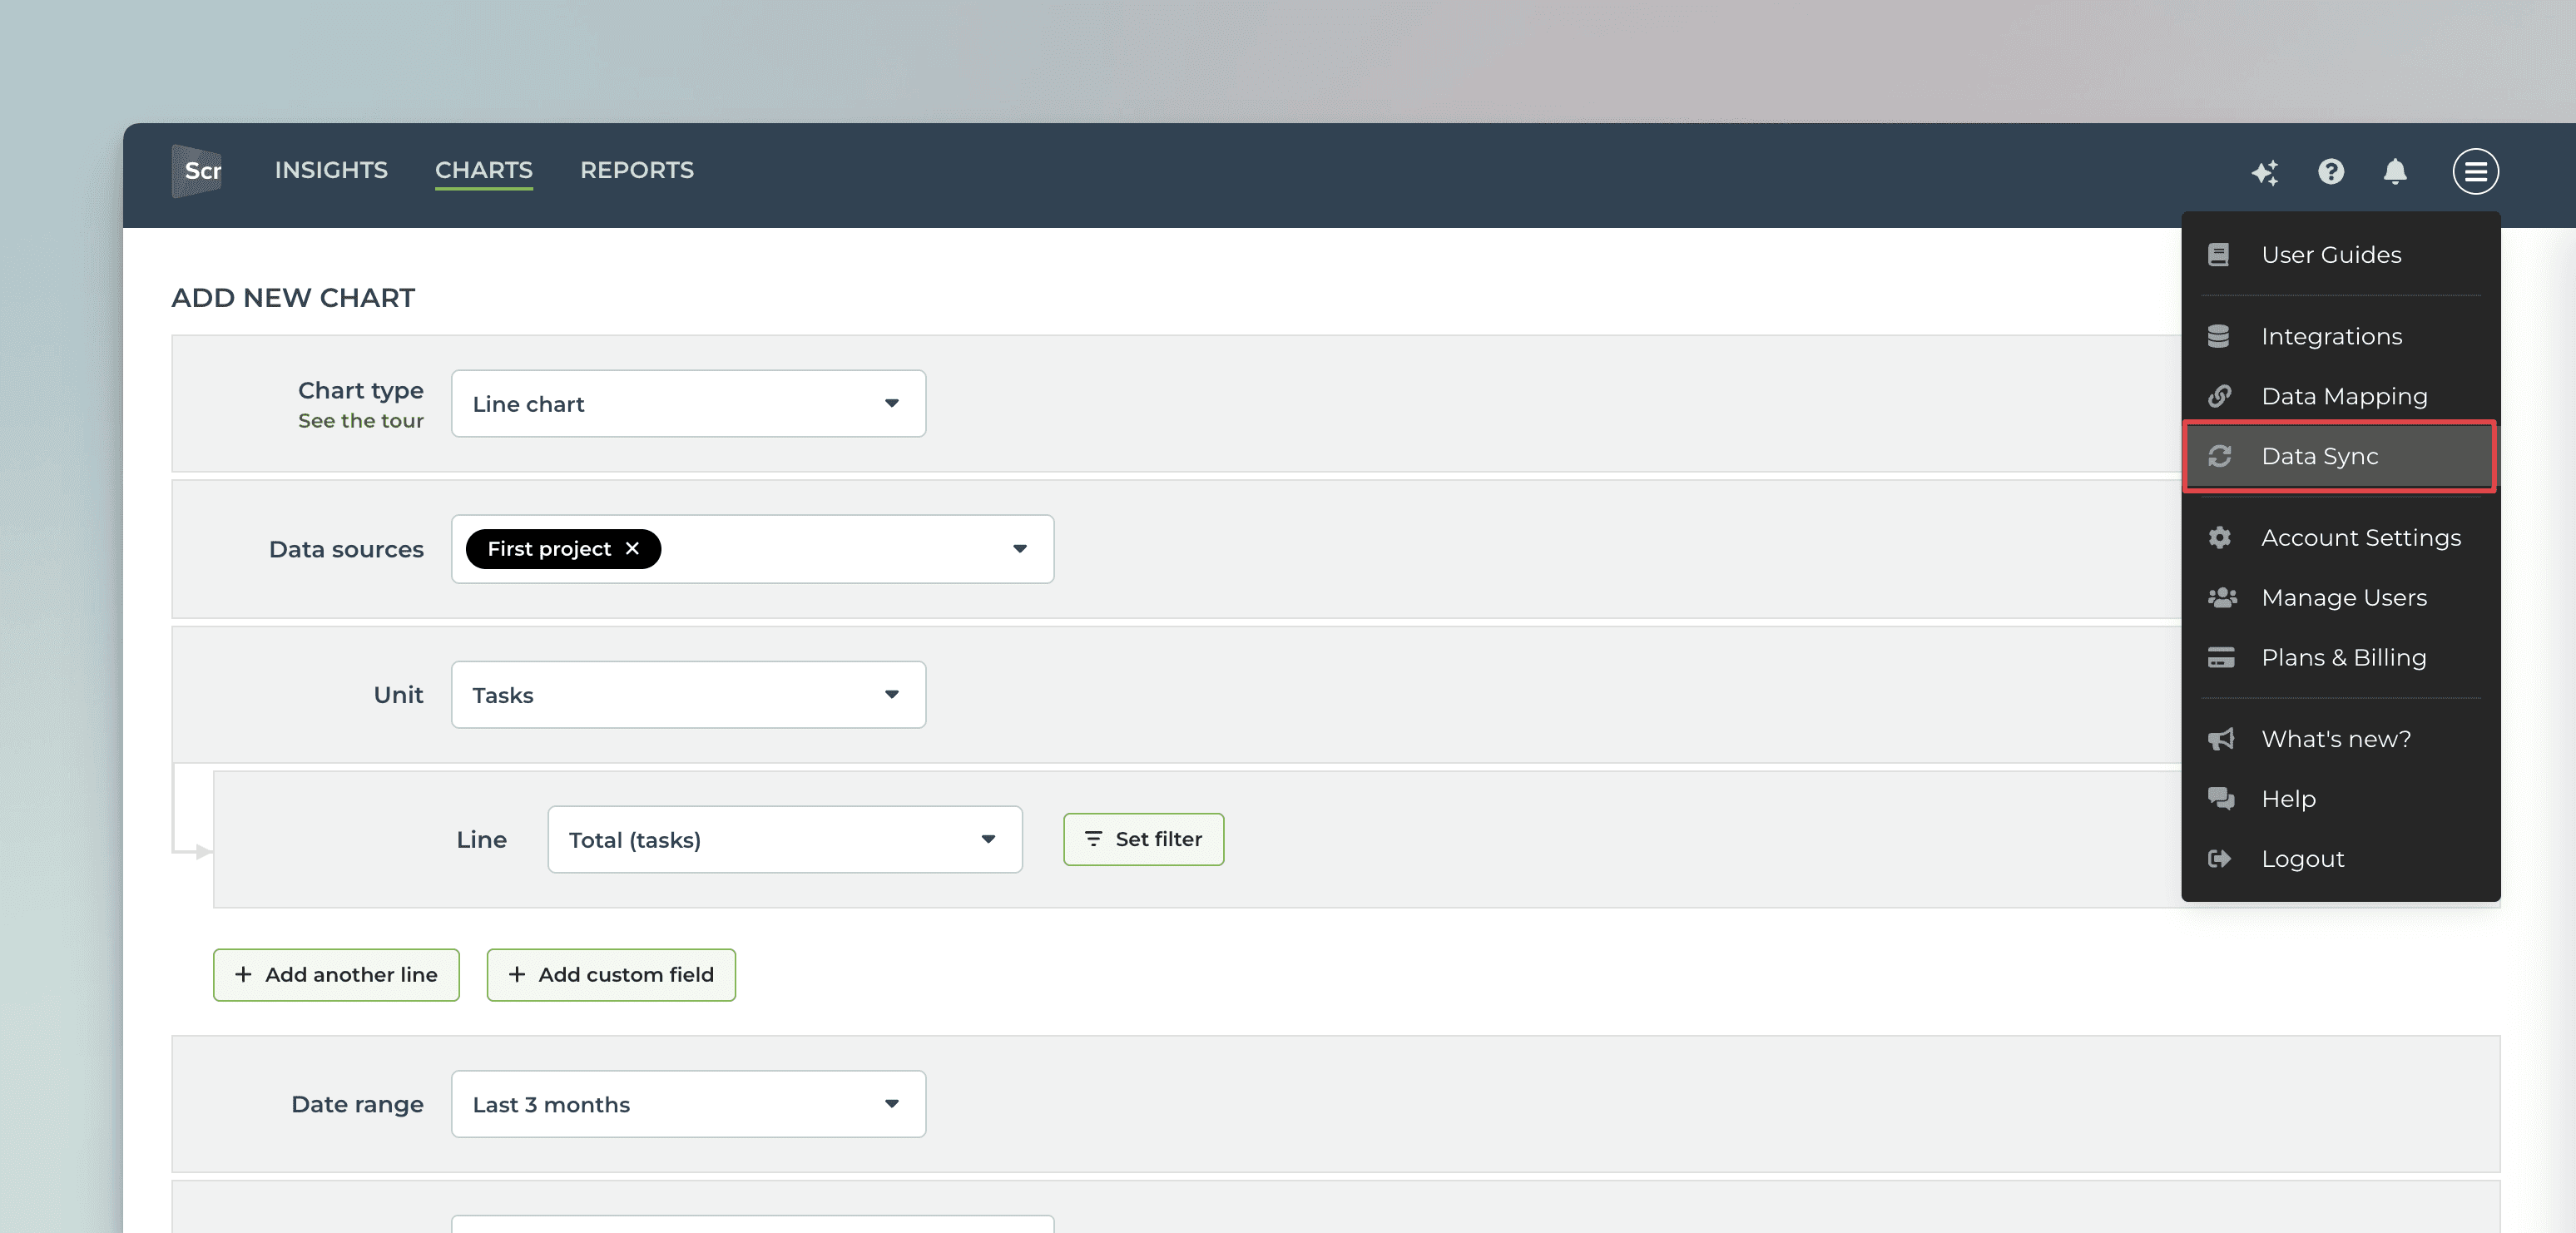
Yes, you can create charts with a prompt and ask questions about a chart by using the Screenful AI Assistant. The assistant combines the leading LLMs with advanced multidimensional data analytics to help you understand and interpret your data.
Yes, you can create charts with a prompt and ask questions about a chart by using the Screenful AI Assistant. The assistant combines the leading LLMs with advanced multidimensional data analytics to help you understand and interpret your data.
What is the difference between these metrics?
Reaction time = time before the work was started
Cycle time = time from start to completion
Lead time = Reaction time + Cycle time
Timing metrics explained: Lead time vs Cycle time
How is the reaction time calculated?
Reaction time starts running when a task is moved into a state that is mapped to the "Not started" in the workflow mapping. The reaction time stops when the task is moved out from that state. If the task is never placed into a state that is mapped to the “Not started” workflow state, then the reaction time is zero.
What if tasks skip lists/columns, or there is no sequential workflow?
The timing information is based on how long items stay in the workflow states that are mapped to "In progress" in the workflow mapping. There is no need for sequential progress, and it is totally fine if tasks skip some of the workflow steps.
What if a task is moved from the “not started” state directly to “done” without going through any of the “in progress” states?
In that case, the cycle time will be zero.
How does the cycle time work if a task is moved into "in progress" and then back to "not started yet"? Similarly, what happens if a card is archived while it's in progress?
Cycle time is calculated only for completed tasks, so in both of those cases, cycle time would be undefined.
If a task is moved from "in progress" to "done", but then back to "in progress" again for additional work would this time be added to the cycle time?
Cycle time is counted only when the task is in progress, so the time spent in the "done" state is not included in the calculation.
When is a task created? Does the clock start when a task is created or when it is put in the "next" state (or equivalent)?
The clock starts when a task is moved to a workflow state that is mapped to the "not started" or "in progress" workflow state.
Are weekends included in the cycle time calculations?
Weekends are included in the calculations by default, but you can change that in the chart settings by selecting 'Exclude non-business hours. See How to set weekend days and office hours
By default yes, but you can specify your working hours and days in the Account Settings.
By default yes, but you can specify your working hours and days in the Account Settings.
Yes, you can configure summaries in Task lists and Table charts to display medians.
Yes, you can configure summaries in Task lists and Table charts to display medians.
Yes, there are a few different ways you can filter out outliers from the charts, including
Filtering by item name
Filtering by how long an item has been in progress
Setting a label and filtering out based on that label
You can learn more from this guide: How to remove outliers from data?
Yes, there are a few different ways you can filter out outliers from the charts, including
Filtering by item name
Filtering by how long an item has been in progress
Setting a label and filtering out based on that label
You can learn more from this guide: How to remove outliers from data?
Does this support my specific workflow or do I have to use some specific states like "open", "in progress" and "done"?
You are not limited to any specific set of states or a workflow. You can configure your own workflow, if such exists, and you can use that in your reporting. It's also ok if you don't have any workflow in your boards, as can create reports based on any other criteria by setting a filter.
You are not limited to any specific set of states or a workflow. You can configure your own workflow, if such exists, and you can use that in your reporting. It's also ok if you don't have any workflow in your boards, as can create reports based on any other criteria by setting a filter.
Yes, you can use custom fields as units, or for grouping and filtering data. Learn more from the integration-specific guides:
Yes, you can use custom fields as units, or for grouping and filtering data. Learn more from the integration-specific guides:
You can embed any custom chart or report to any web page using the embed code. Learn more about the sharing feature from the online guide.
You can embed any custom chart or report to any web page using the embed code. Learn more about the sharing feature from the online guide.
The Getting Started Guide contains Instructions for setting up Screenful.
See also our Accounts & Pricing FAQ or ask our AI assistant.
Check out our knowledge base and video tutorials, or get in touch by emailing support@screenful.com
The Getting Started Guide contains Instructions for setting up Screenful.
See also our Accounts & Pricing FAQ or ask our AI assistant.
Check out our knowledge base and video tutorials, or get in touch by emailing support@screenful.com