With Screenful, you can track how long tasks spend in a specific workflow state on average. There are two ways to calculate that average: you can calculate it from all completed tasks, or only from those tasks that visited that state.
Create Cycle Time By Workflow State chart from a template
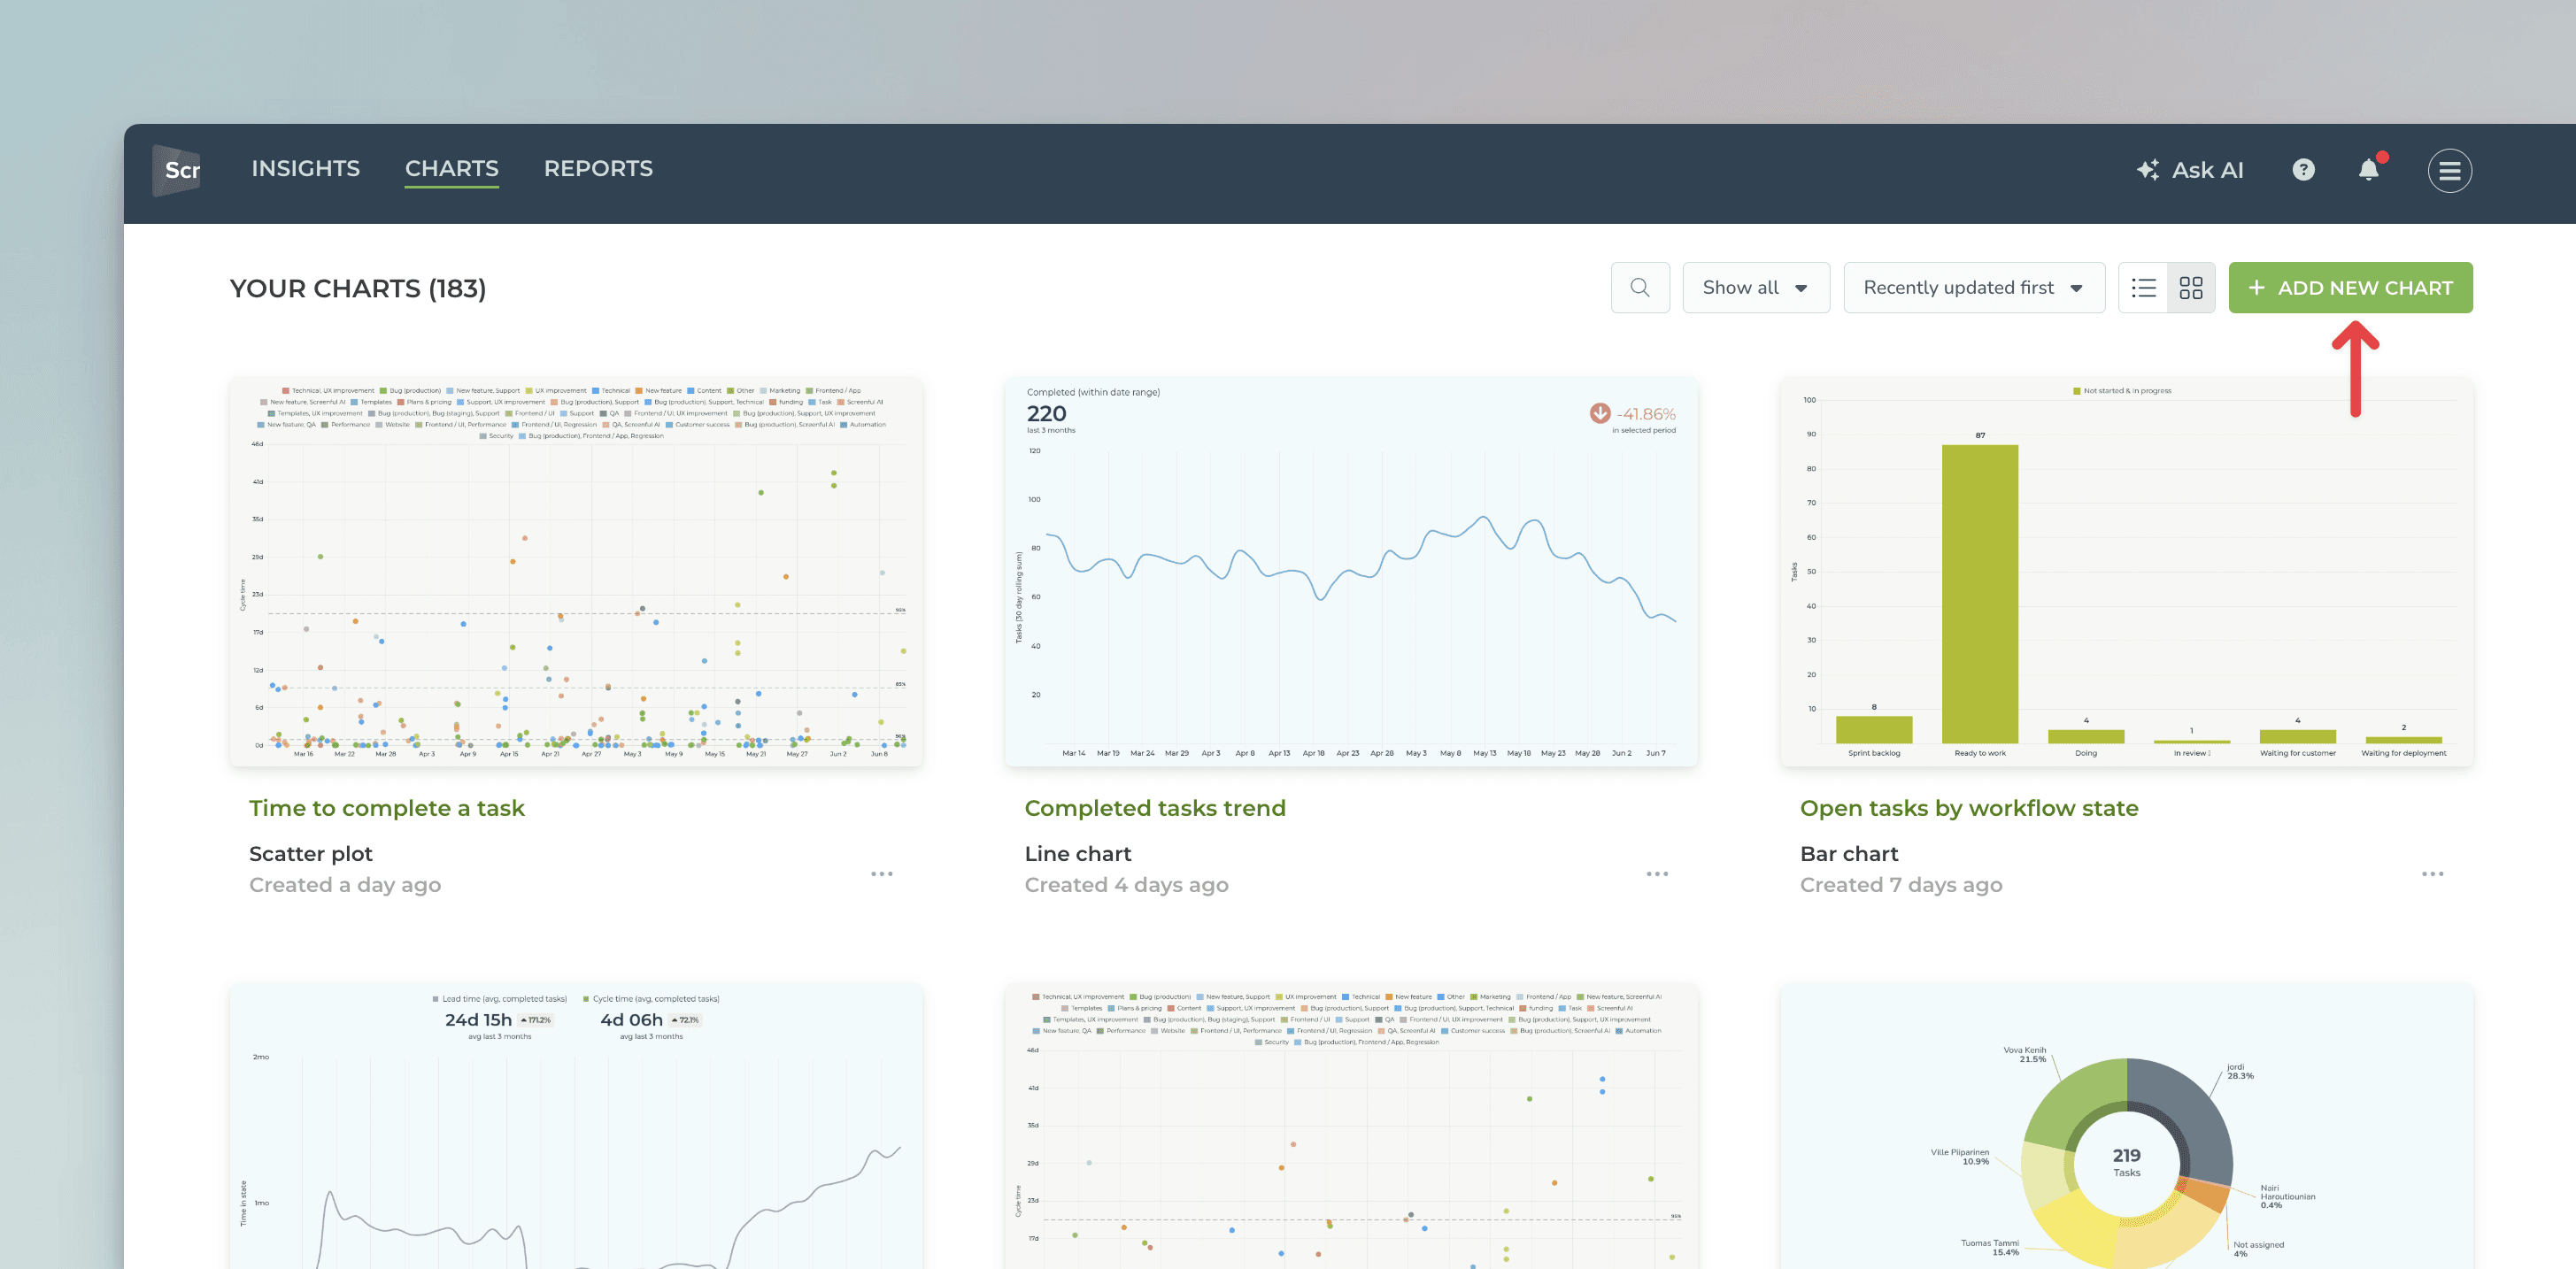
Start by navigating to the Charts tab and clicking Add new chart from the top right corner:
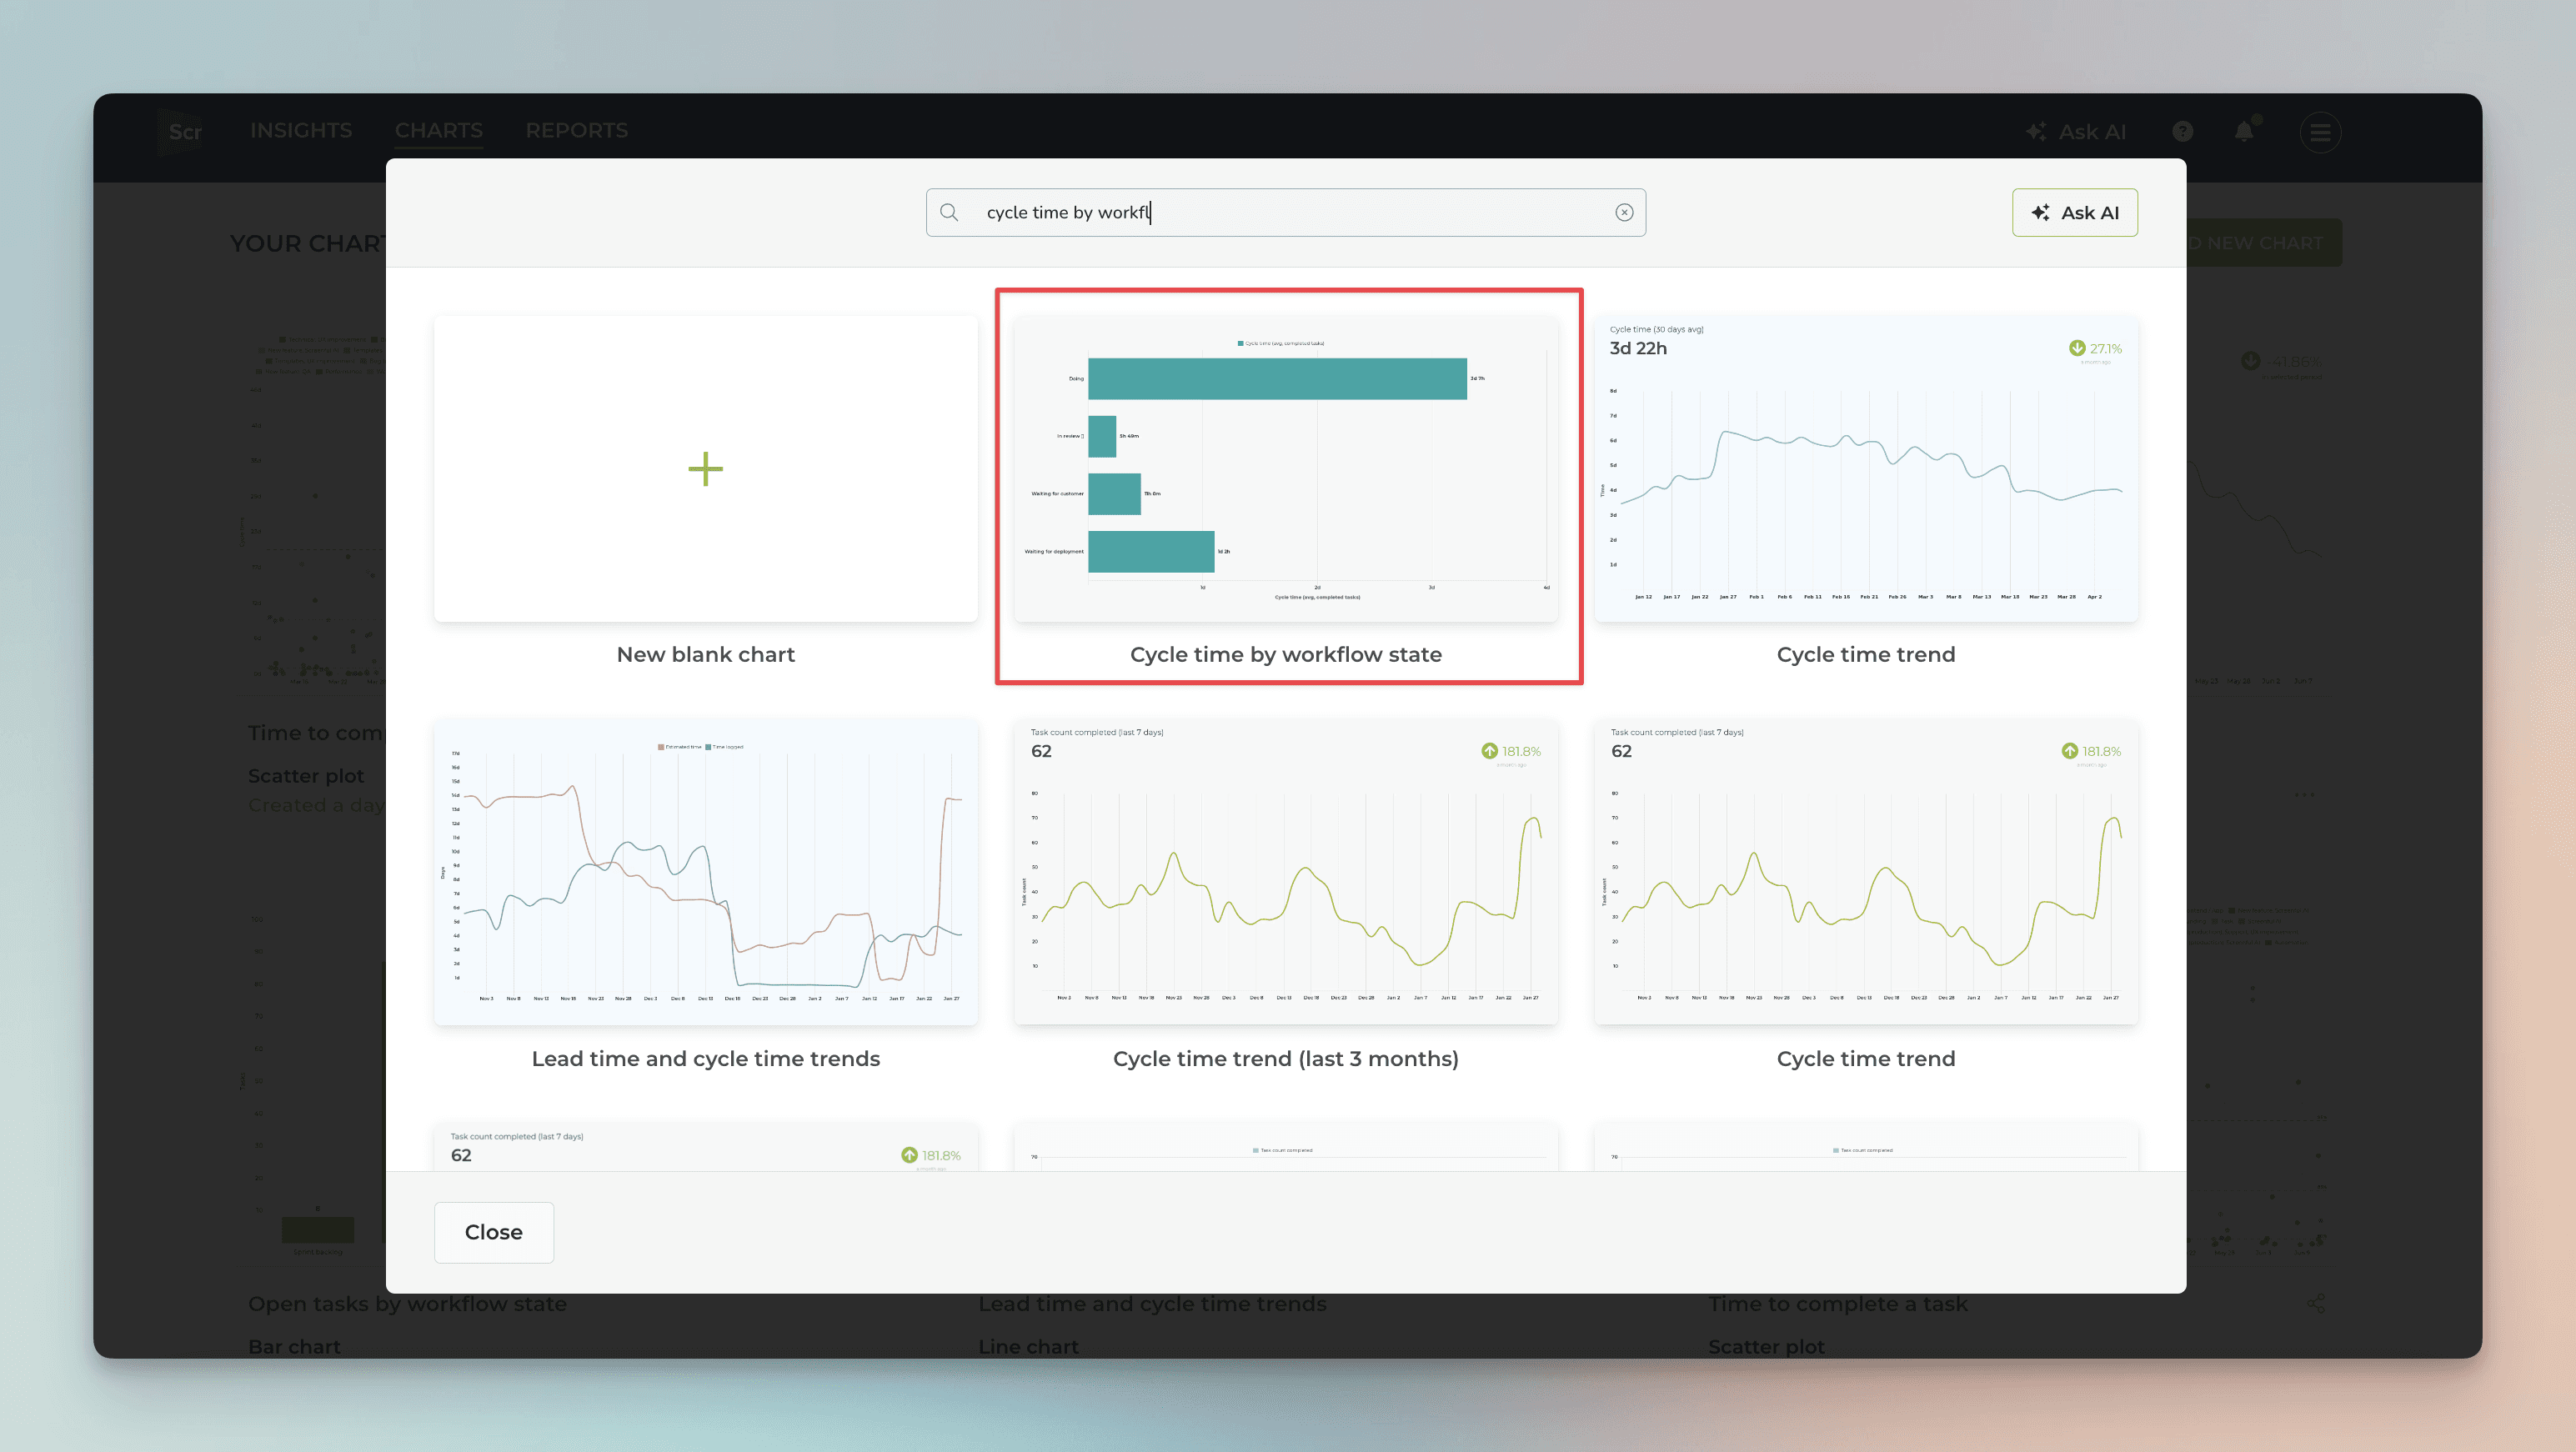
A chart modal is opened with ready-made templates. Search for Cycle time by workflow state to locate the correct template.
This chart shows the average time spent in each In progress workflow state.
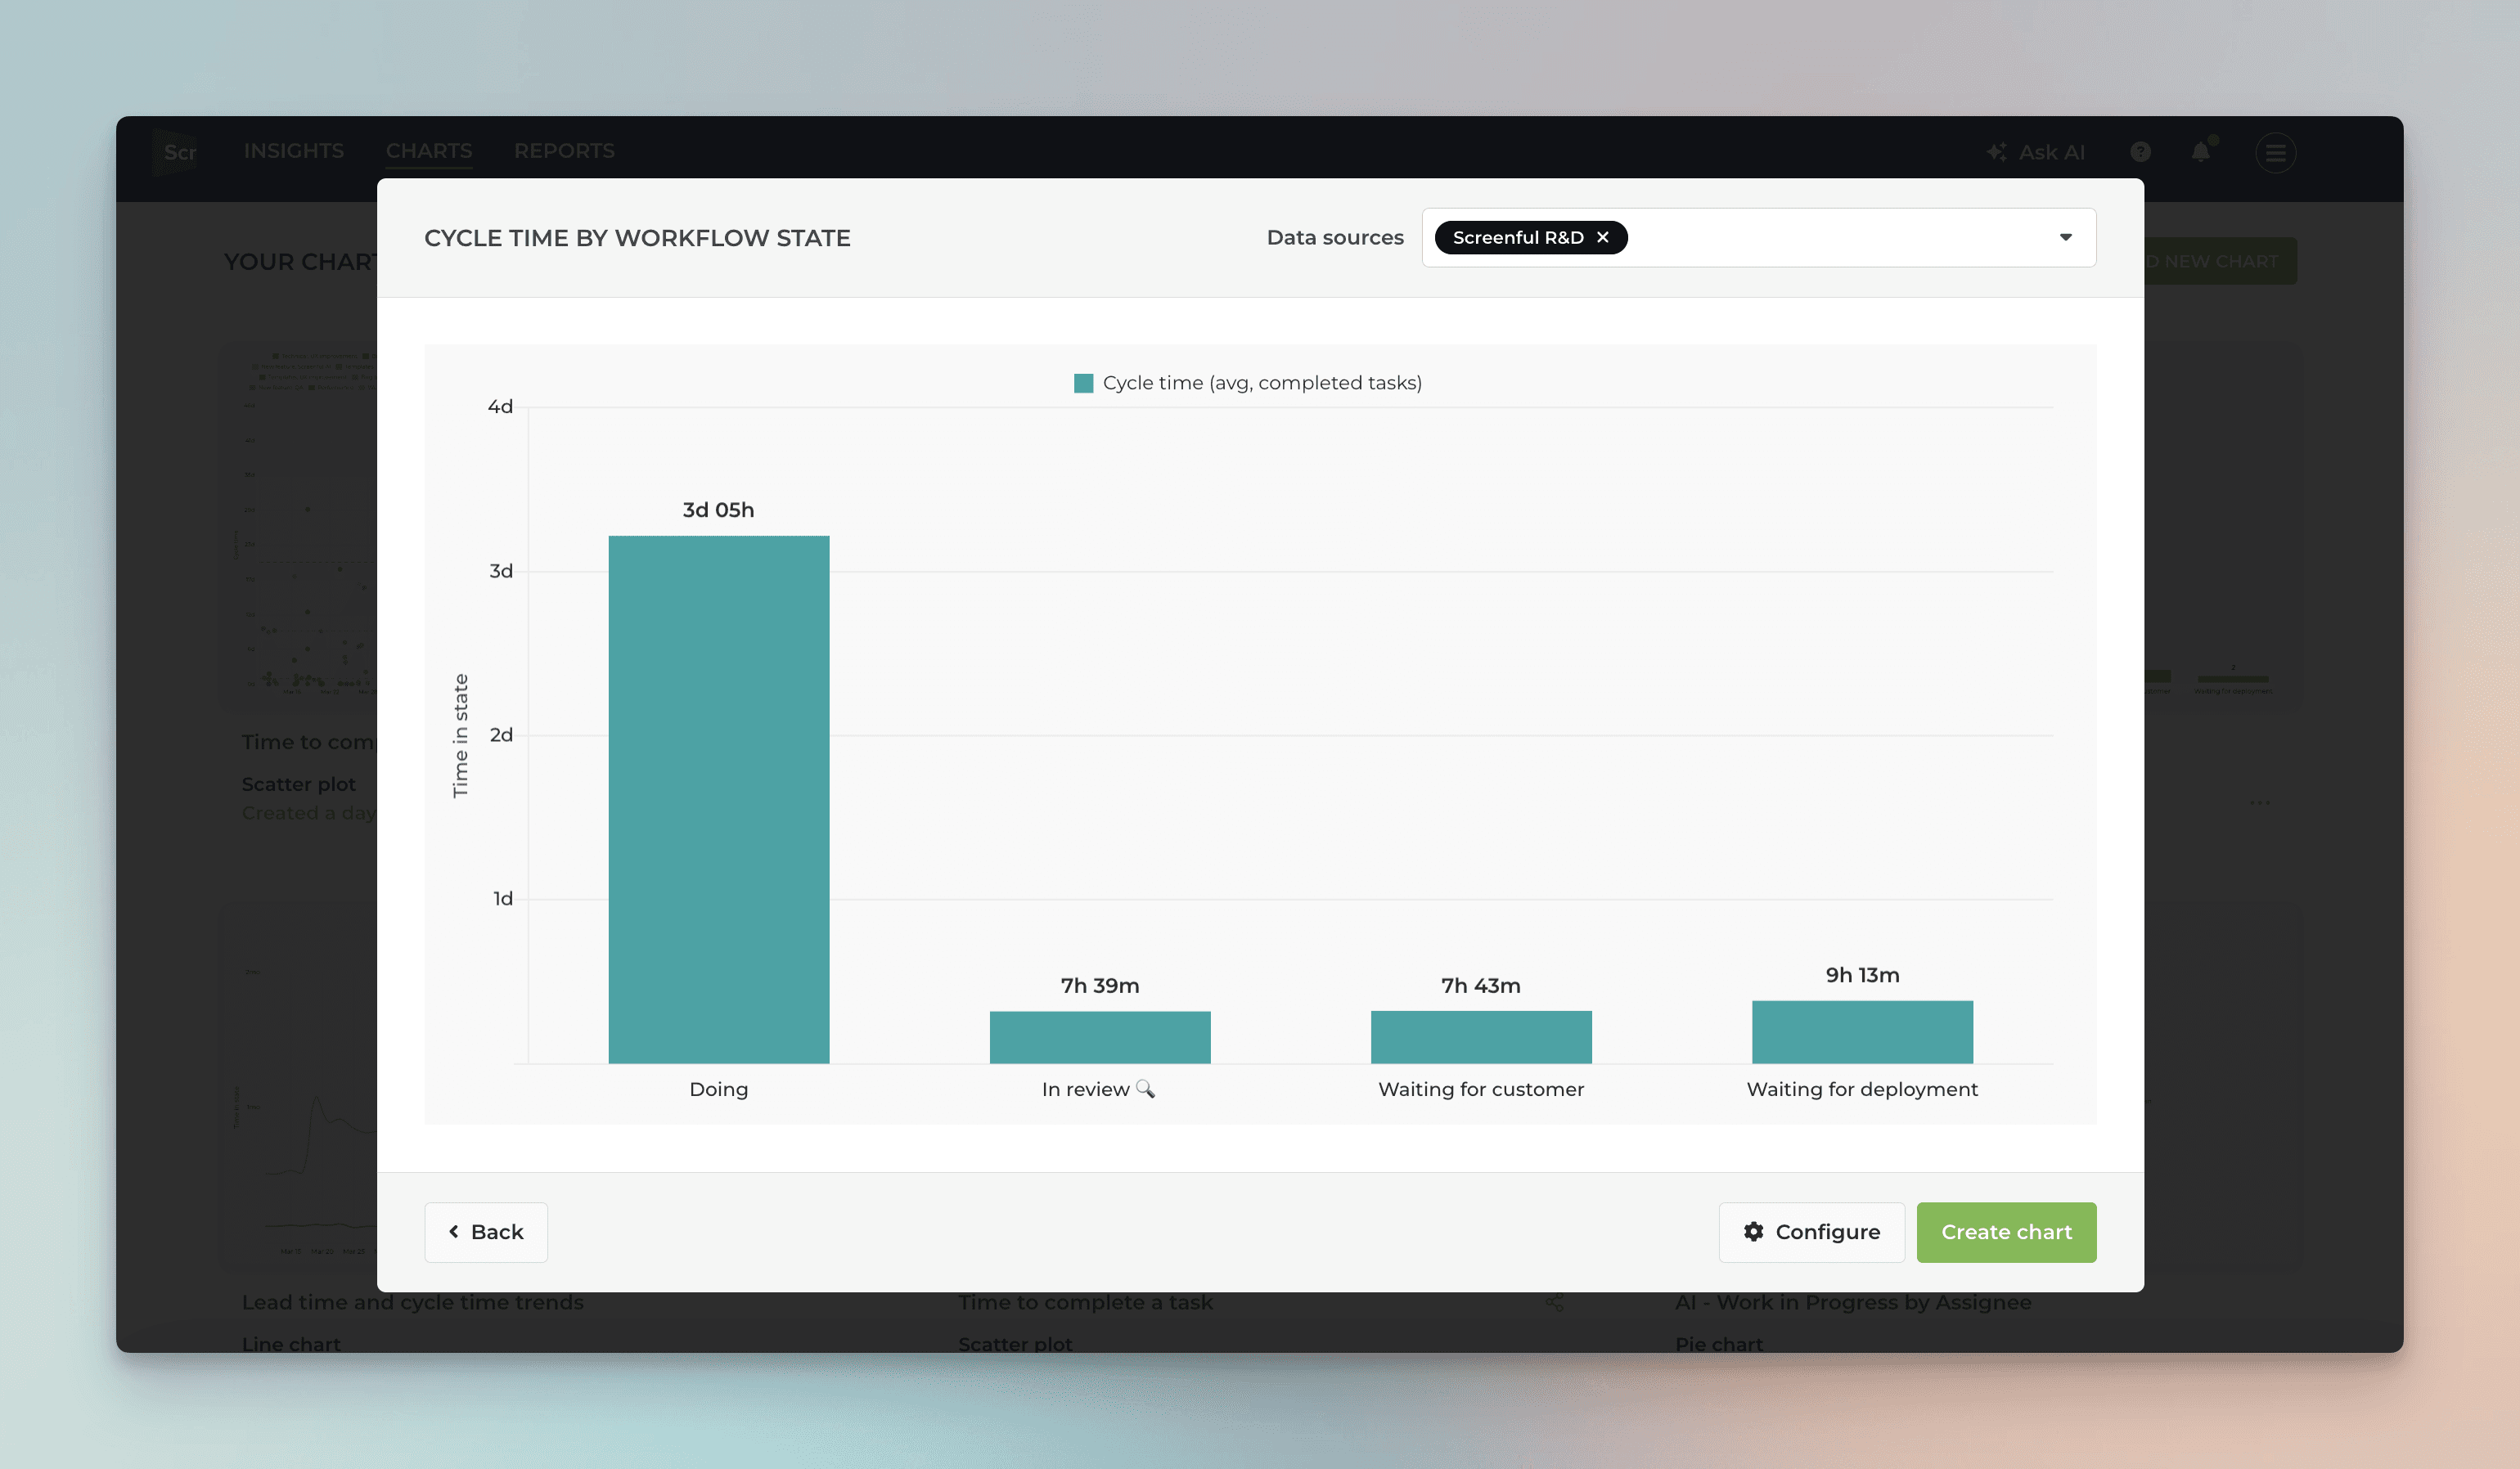
In this example, tasks go through the states Doing, In review, Waiting for customer, and Waiting for deployment, before they are completed. However, some tasks may skip certain states.
Timing metrics explained: Lead time vs Cycle time
By default, the chart averages the timings of all completed tasks within the selected date range, even those that never visited some specific state. Therefore, it answers the question:
What is the ratio of time spent on that state compared to all other states?
If most of your tickets never go to the Waiting for customer state, the large number of zeros will drive down the average.
But what if you want to see the average only from those tickets that visited that state? You can do that by setting a filter for Time in progress.
Set a filter to include only those tasks that visited the state
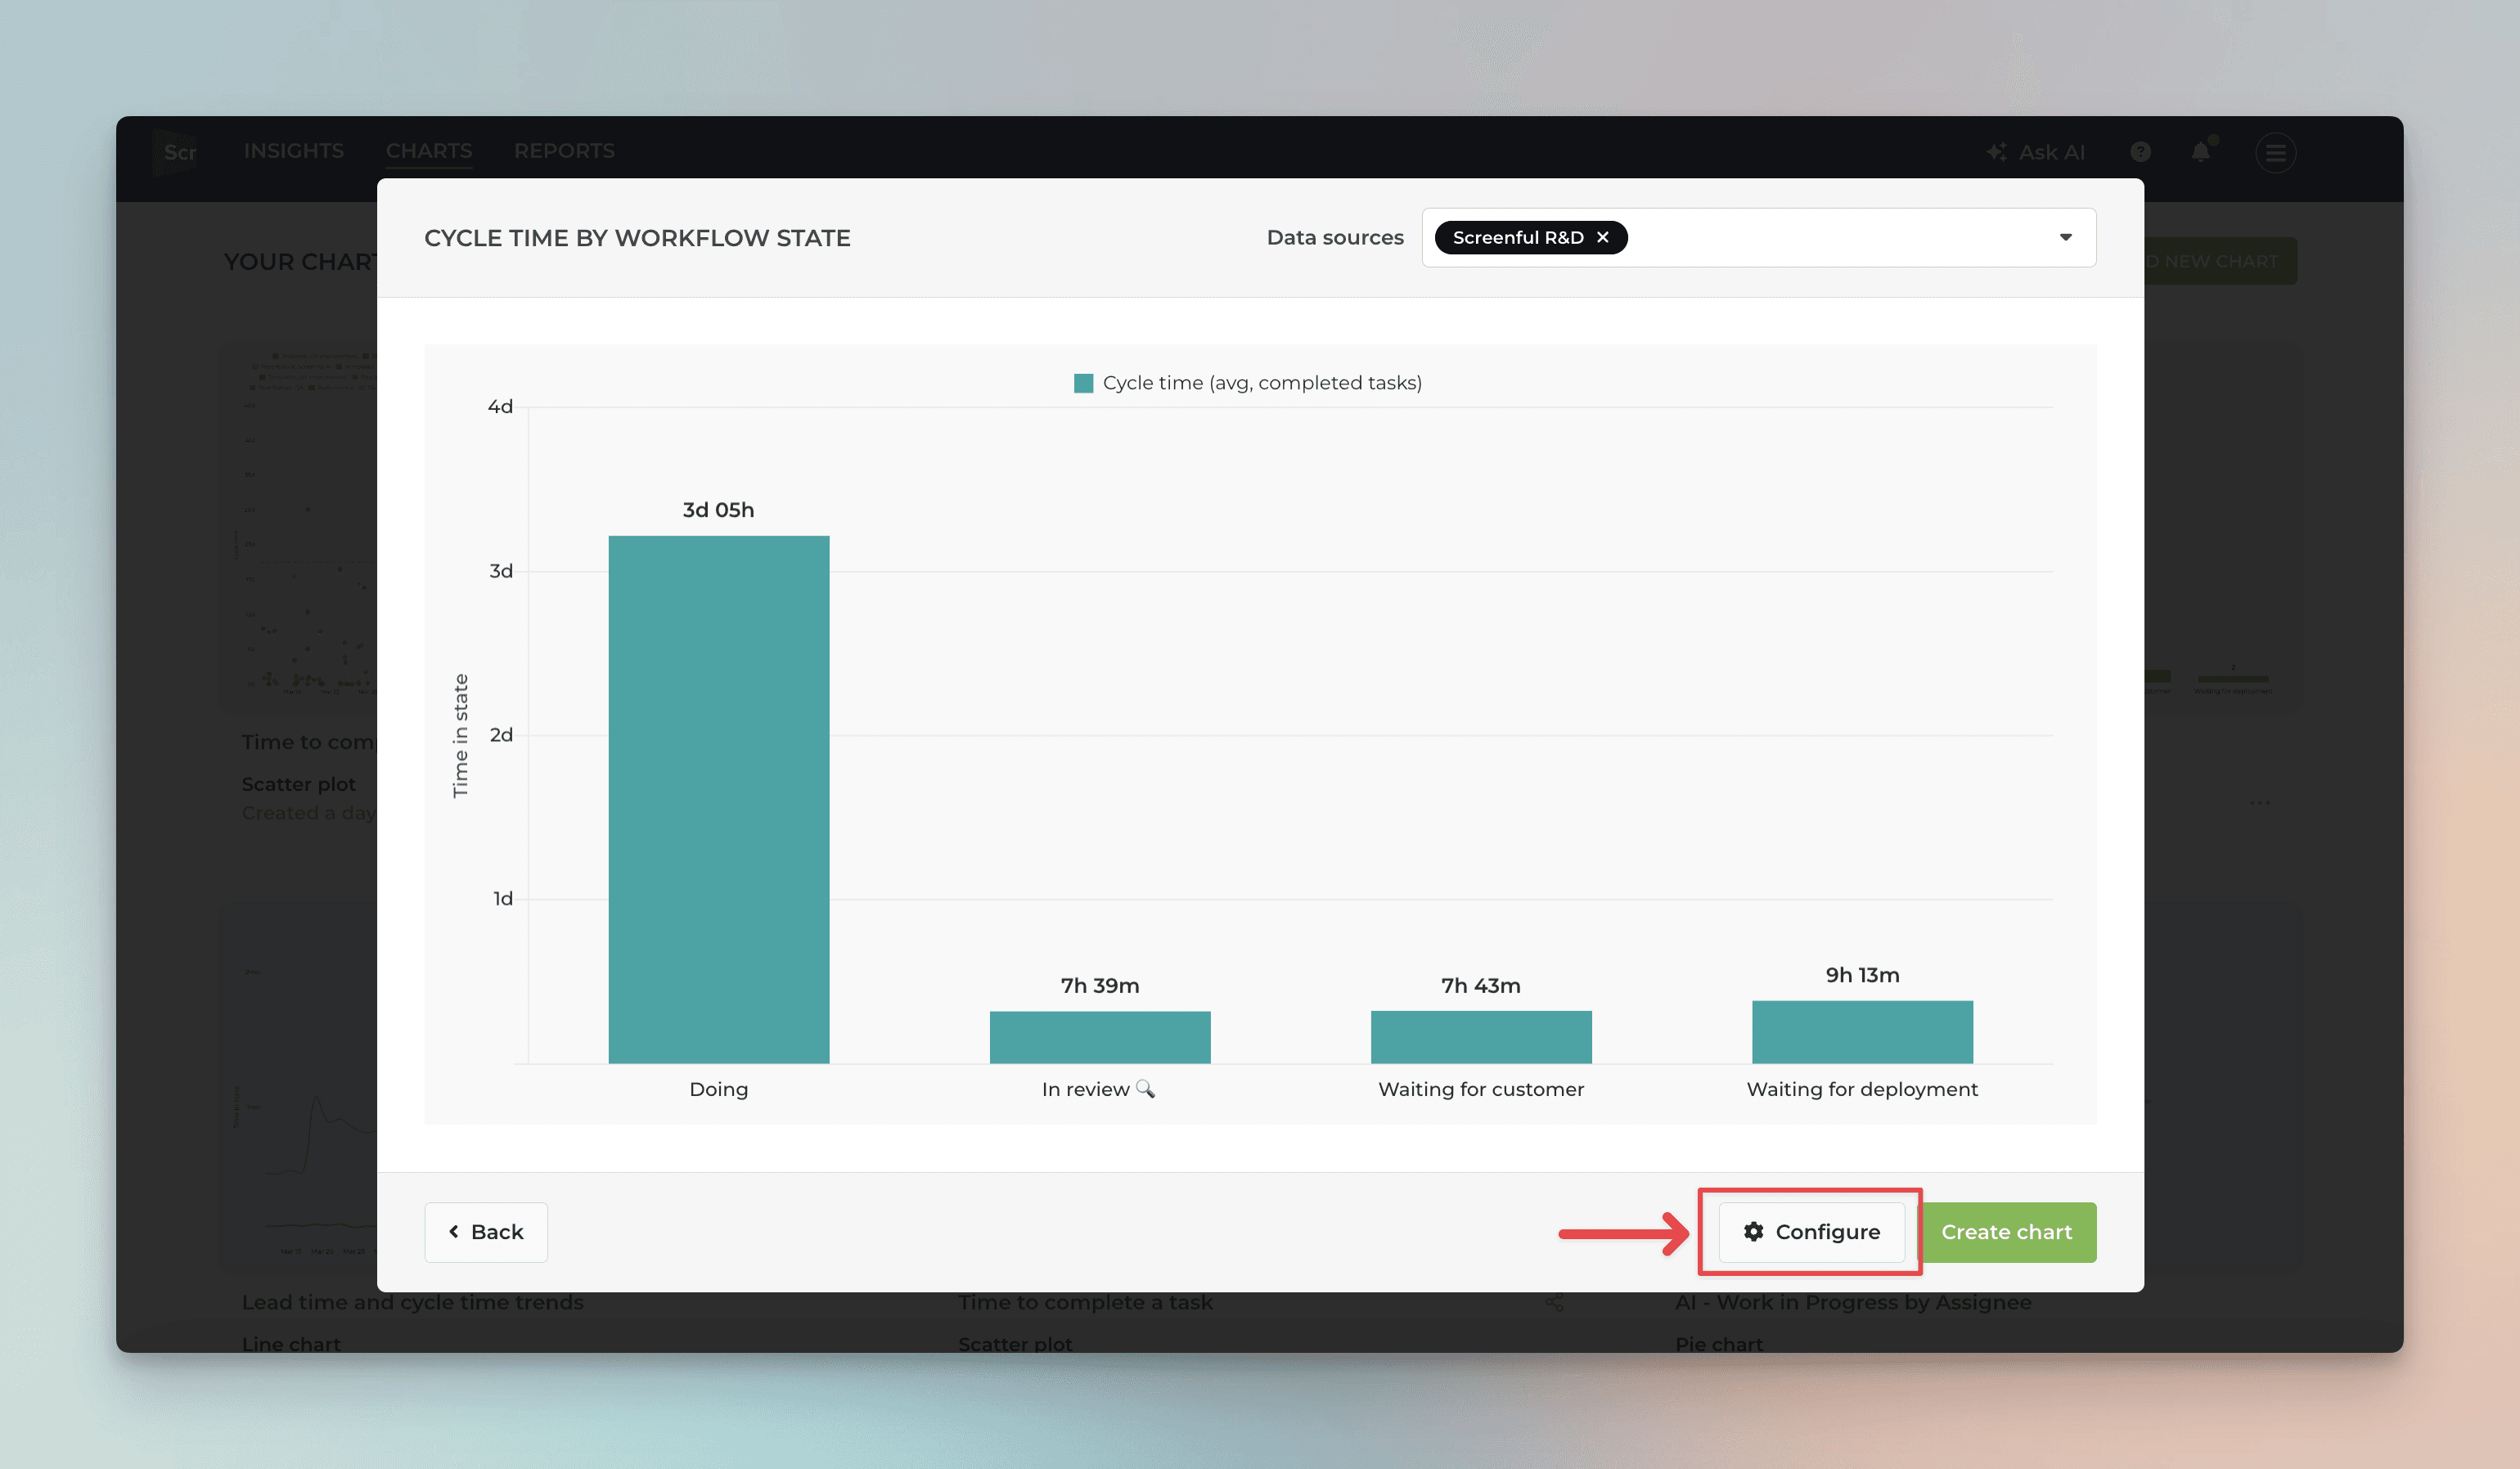
To set a filter for the chart, click Configure:
A chart editor is shown, allowing you to make adjustments. Click the Set filter button:
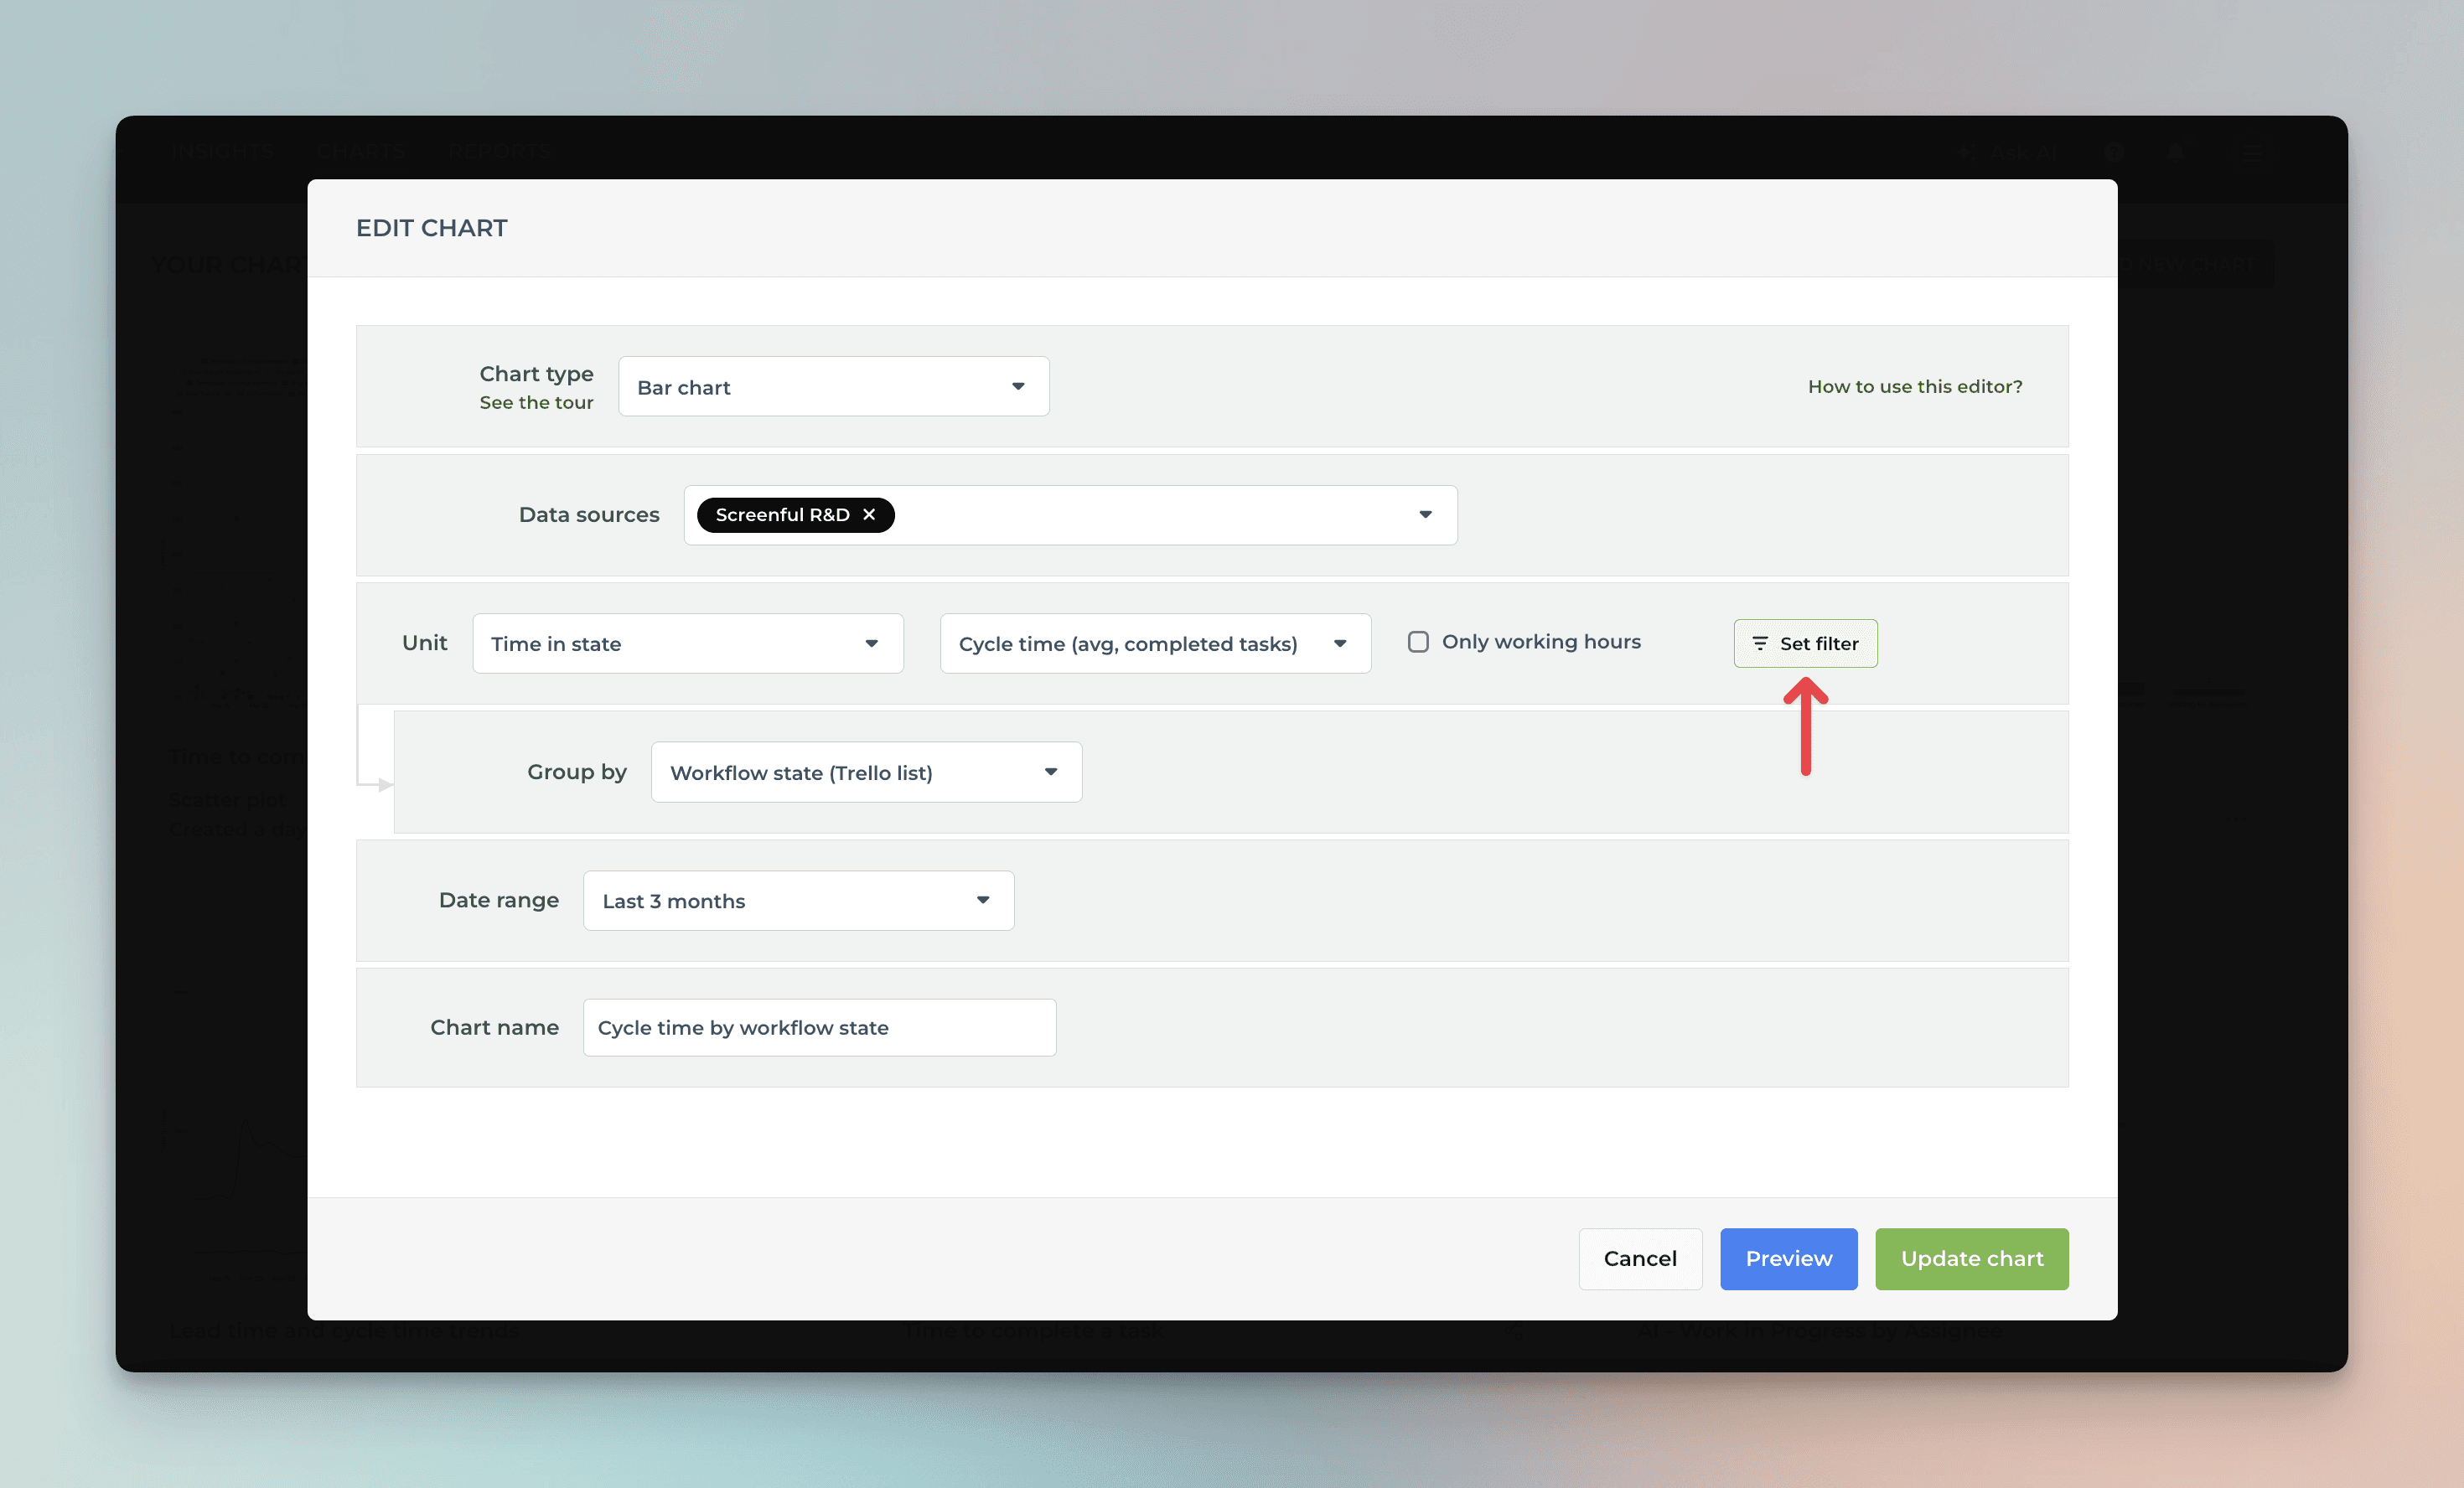
In the filter modal, set a filter Time in progress > 0.
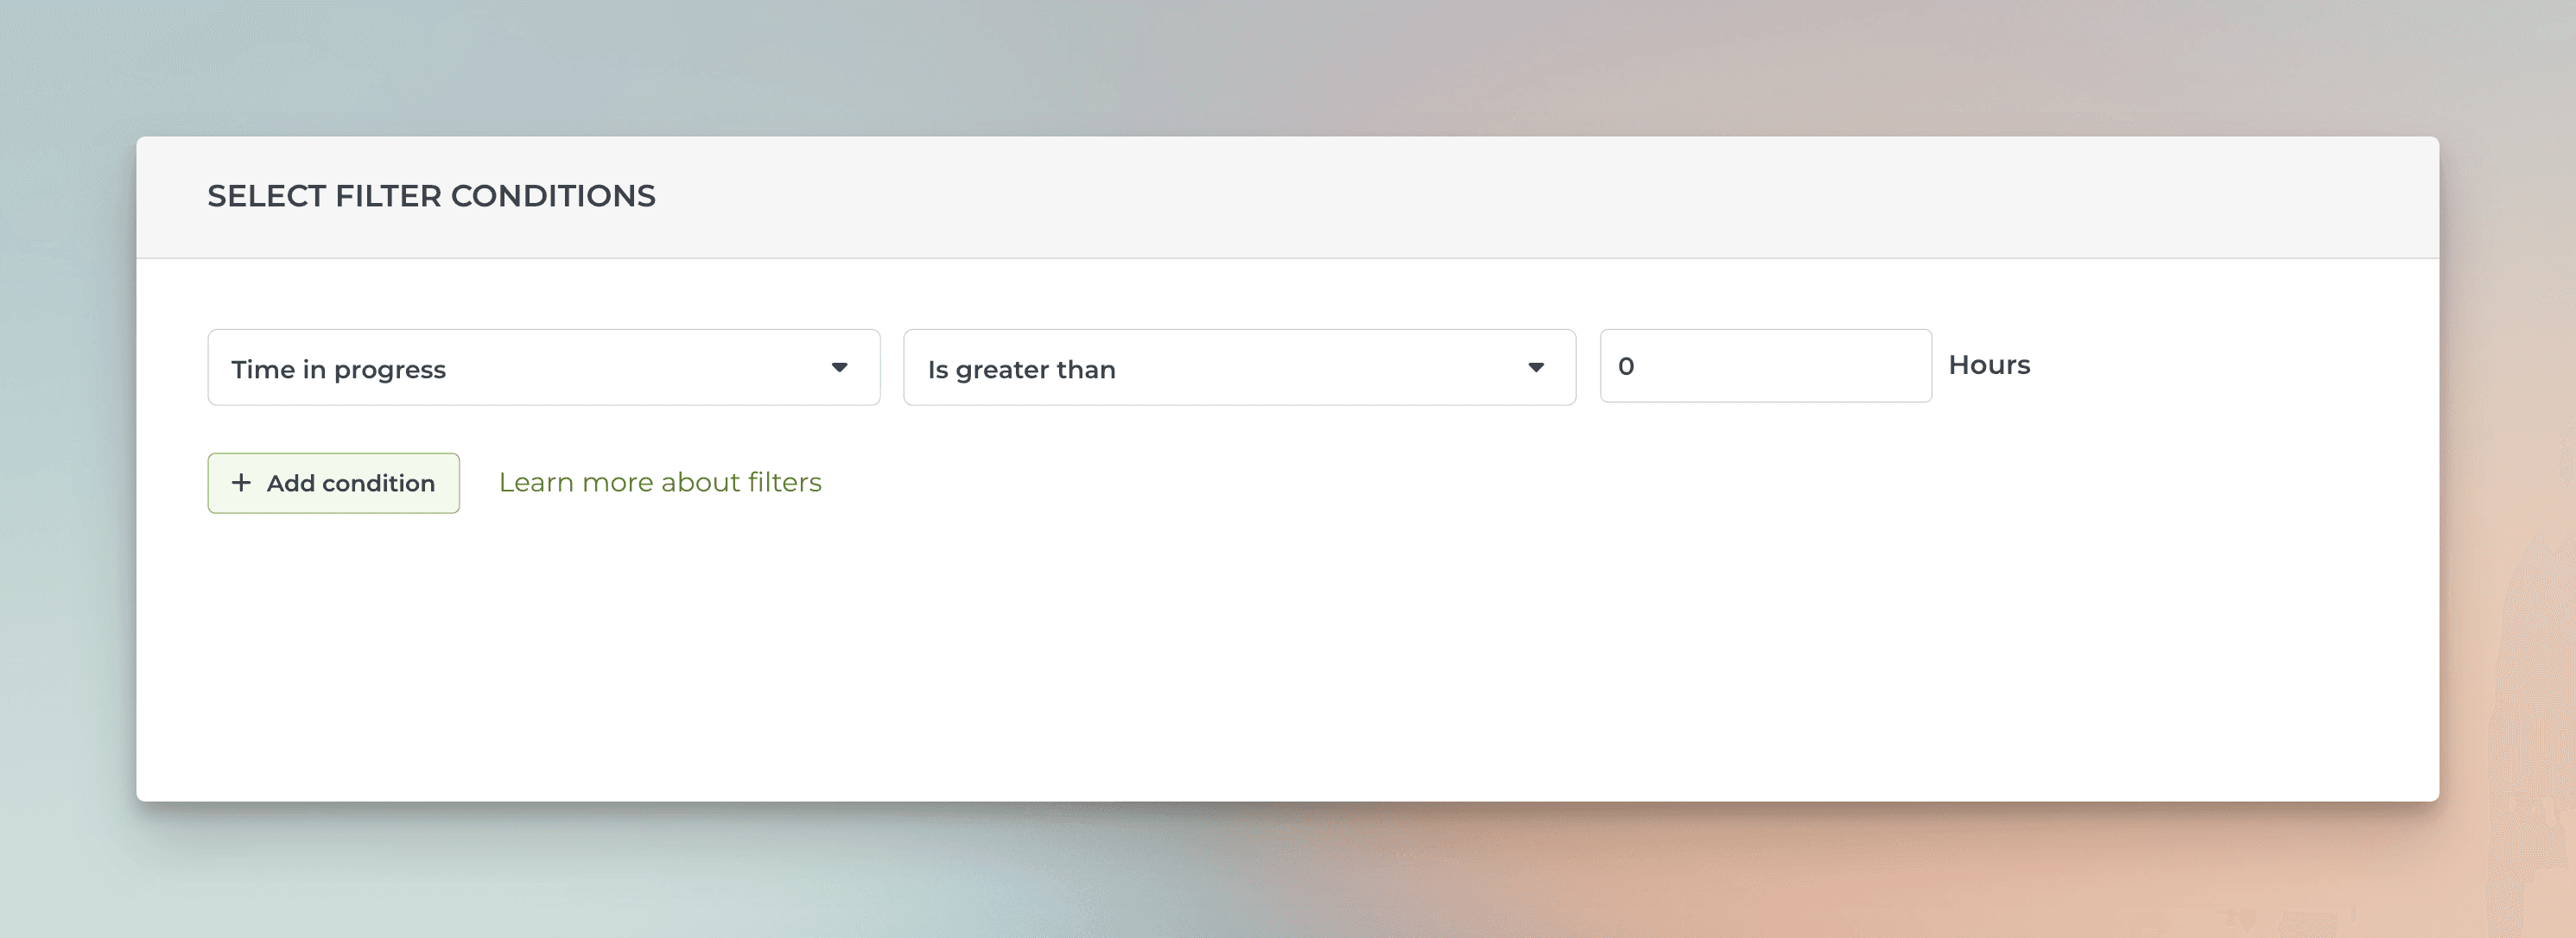
Clicking Save, applies the filter to the chart, which now displays average timings for each workflow state, including only the items that visited that state.
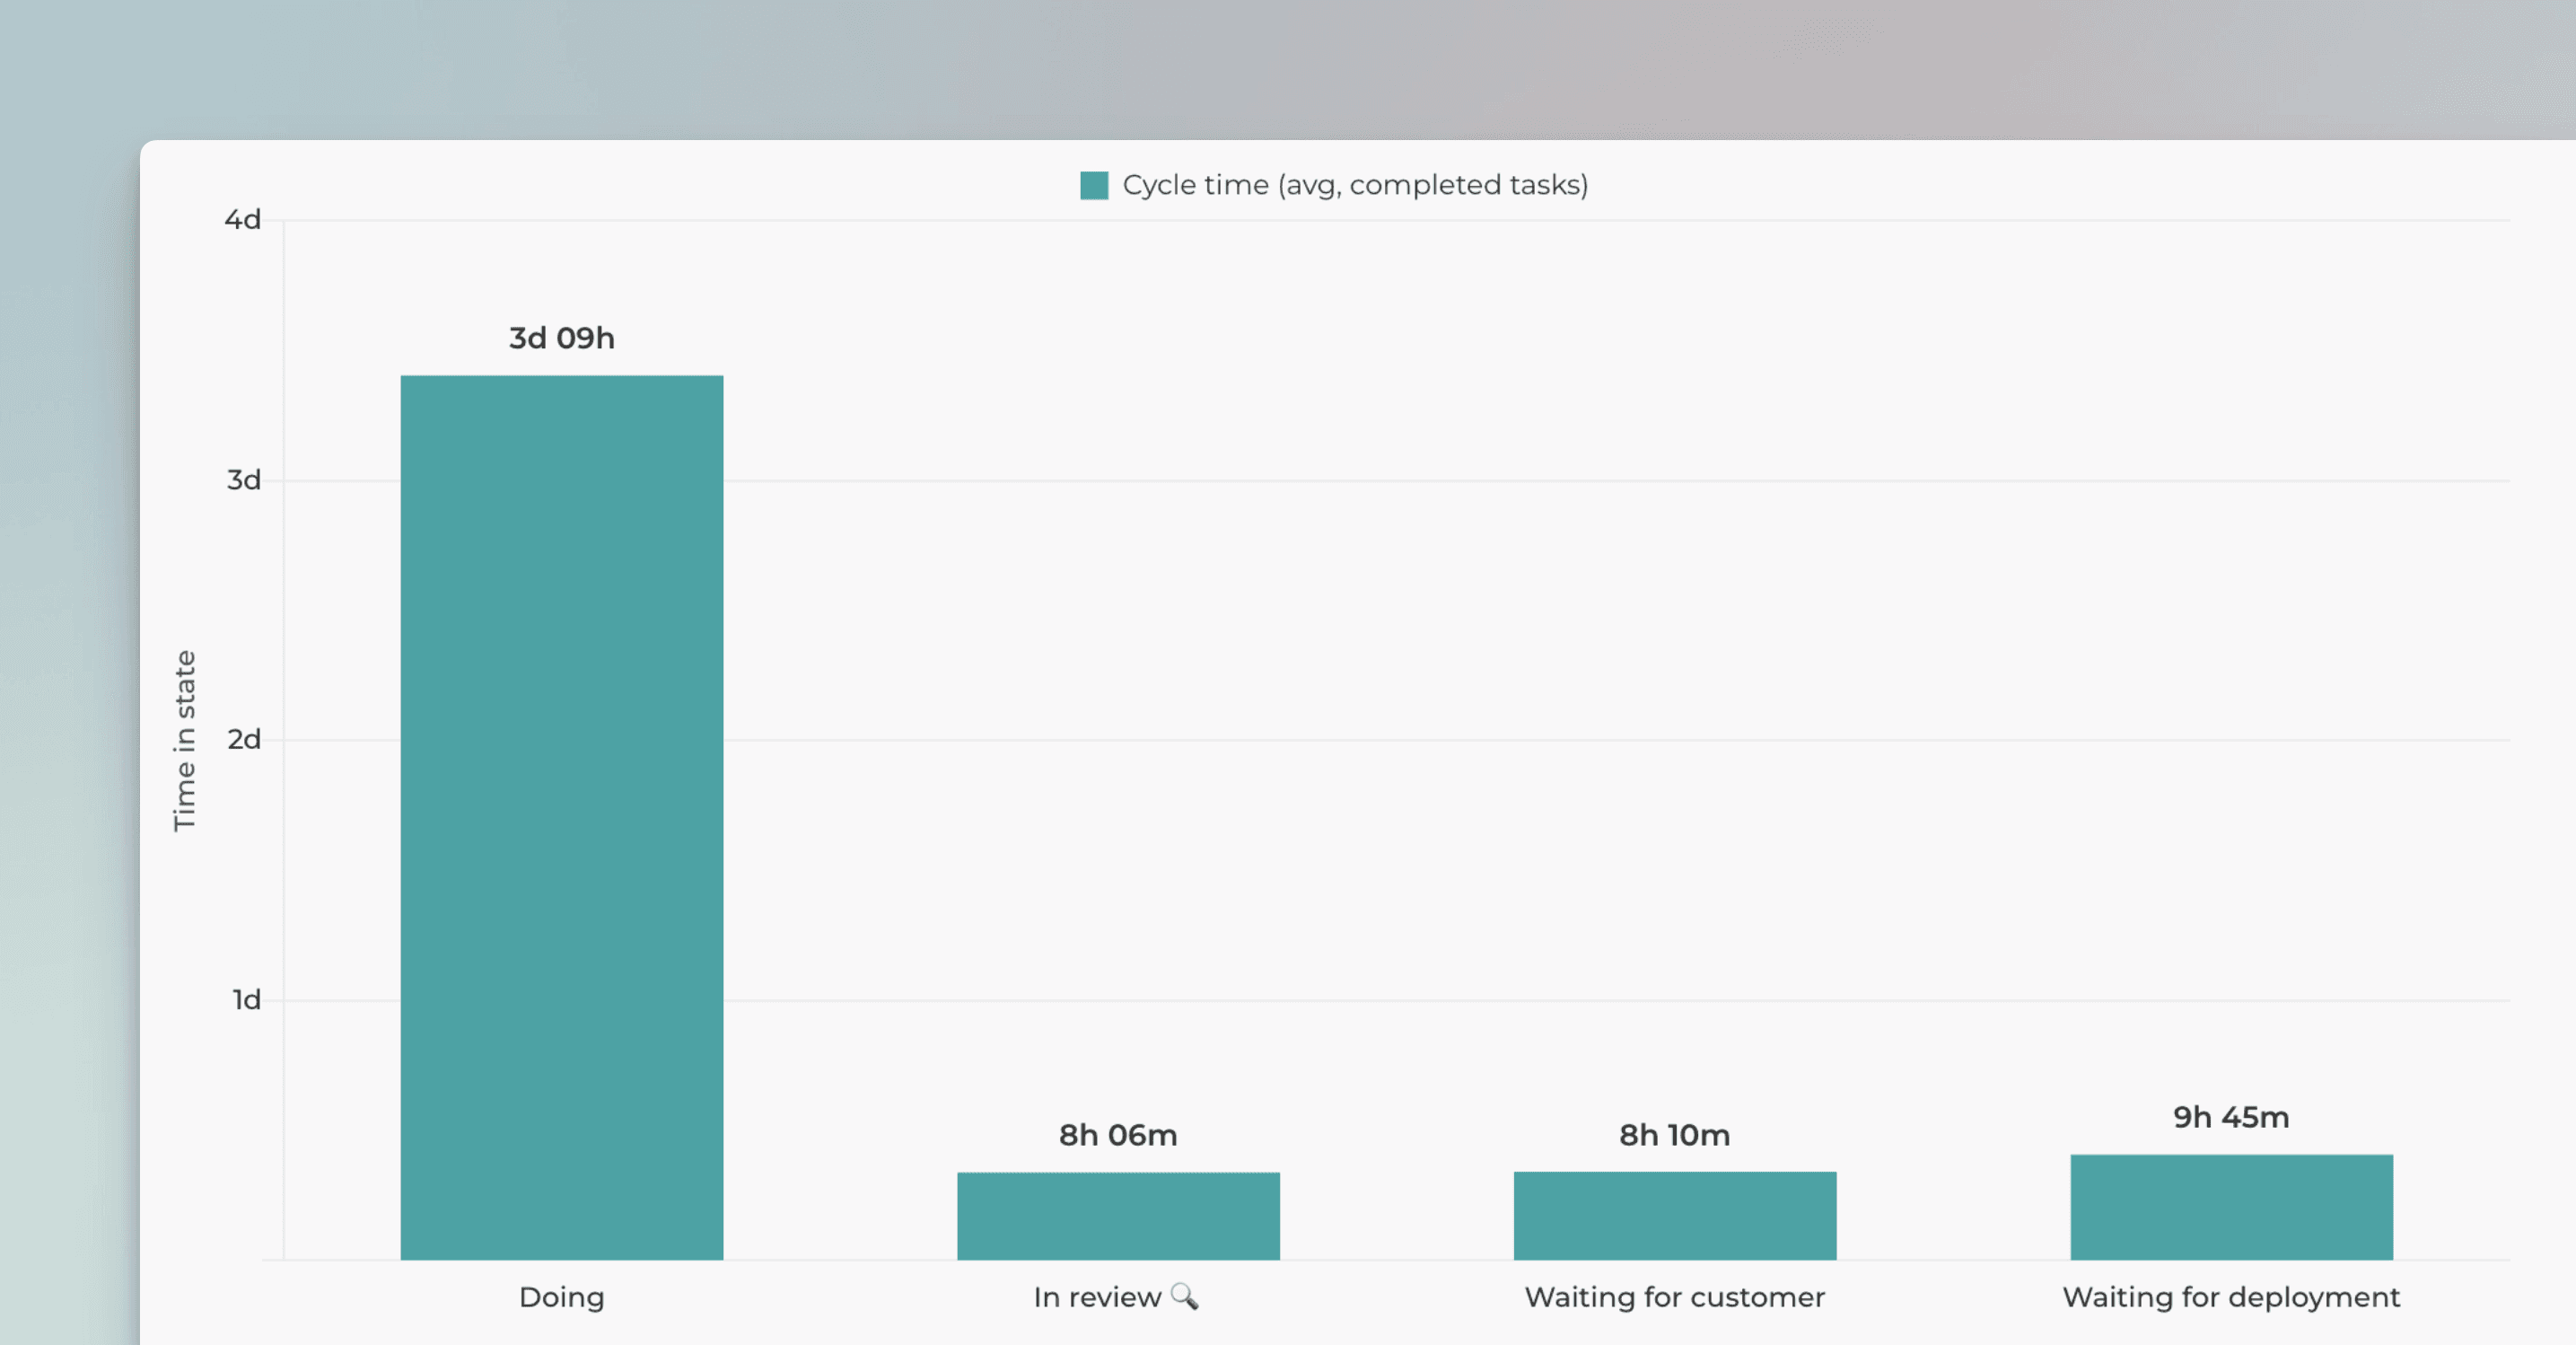
You can click the bars to see the list of items that make up the number:
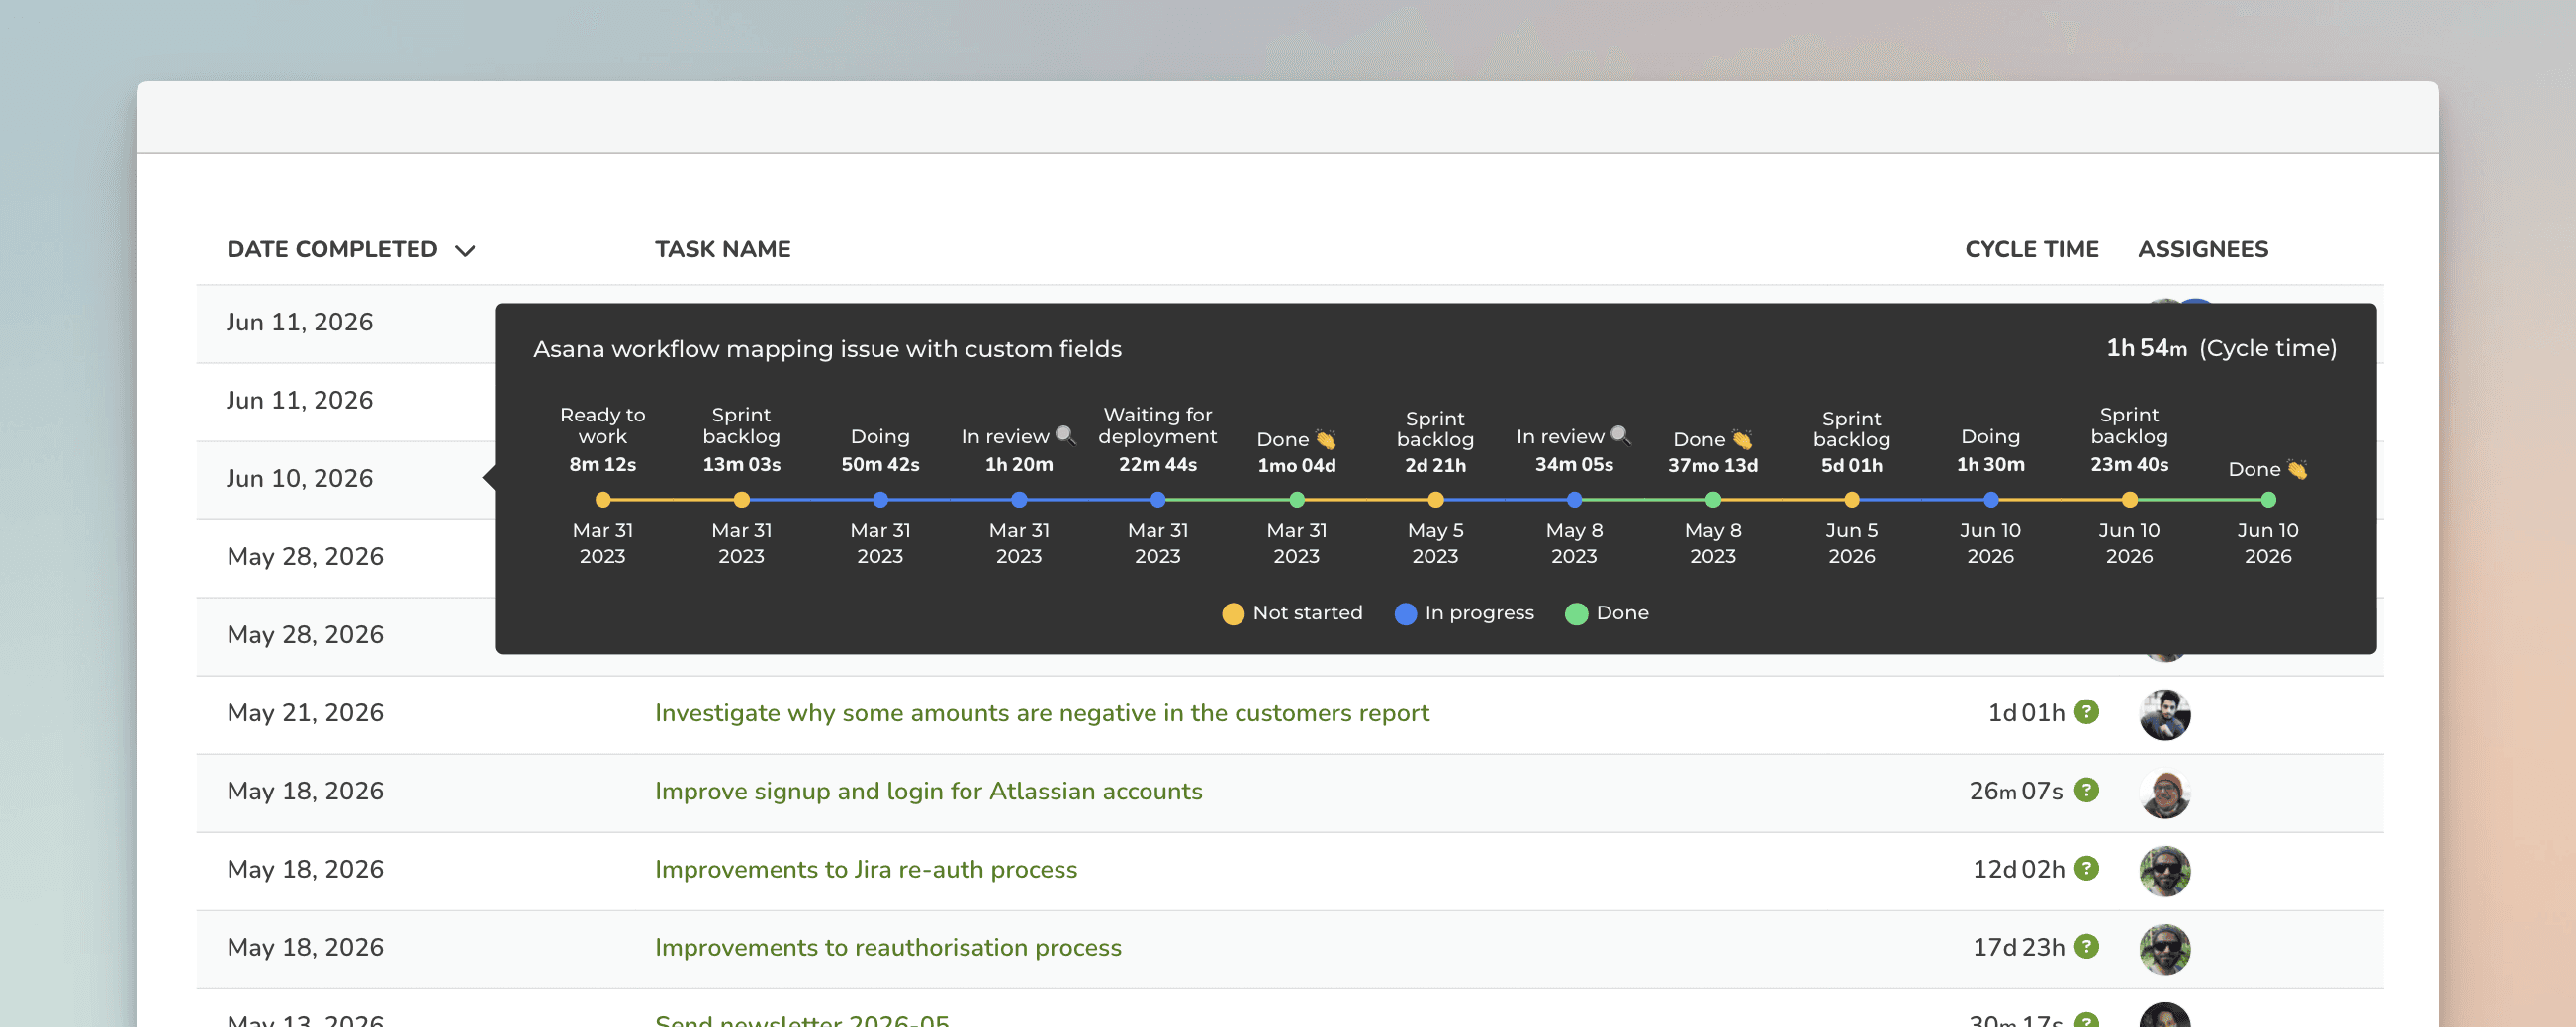
The Cycle time column shows the total time spent on that specific workflow state. You can click the column header to sort the list by the time spent on that state.
When you hover over the green question mark, you can view the task's complete journey to completion, including all transitions and back-and-forth movements between states.
Learn more
Book a free onboarding call
Need help with setting up your charts and reports? Don't find a metric you are looking for? Book a call with our expert. We'd love to help you supercharge your reporting!


