With Screenful, you can track how long it takes to complete a task. You can see the lead and cycle times for individual tasks and how tasks spend time in each workflow state. You can also track average and median times across a group of tasks.
Track medians in the Task list chart
If you add any numerical or timing fields as columns to the Task list chart, the values are summarized on the bottom row. To configure this behavior, go to Chart settings and toggle Show summary row to enable or disable the summary row for the chart.
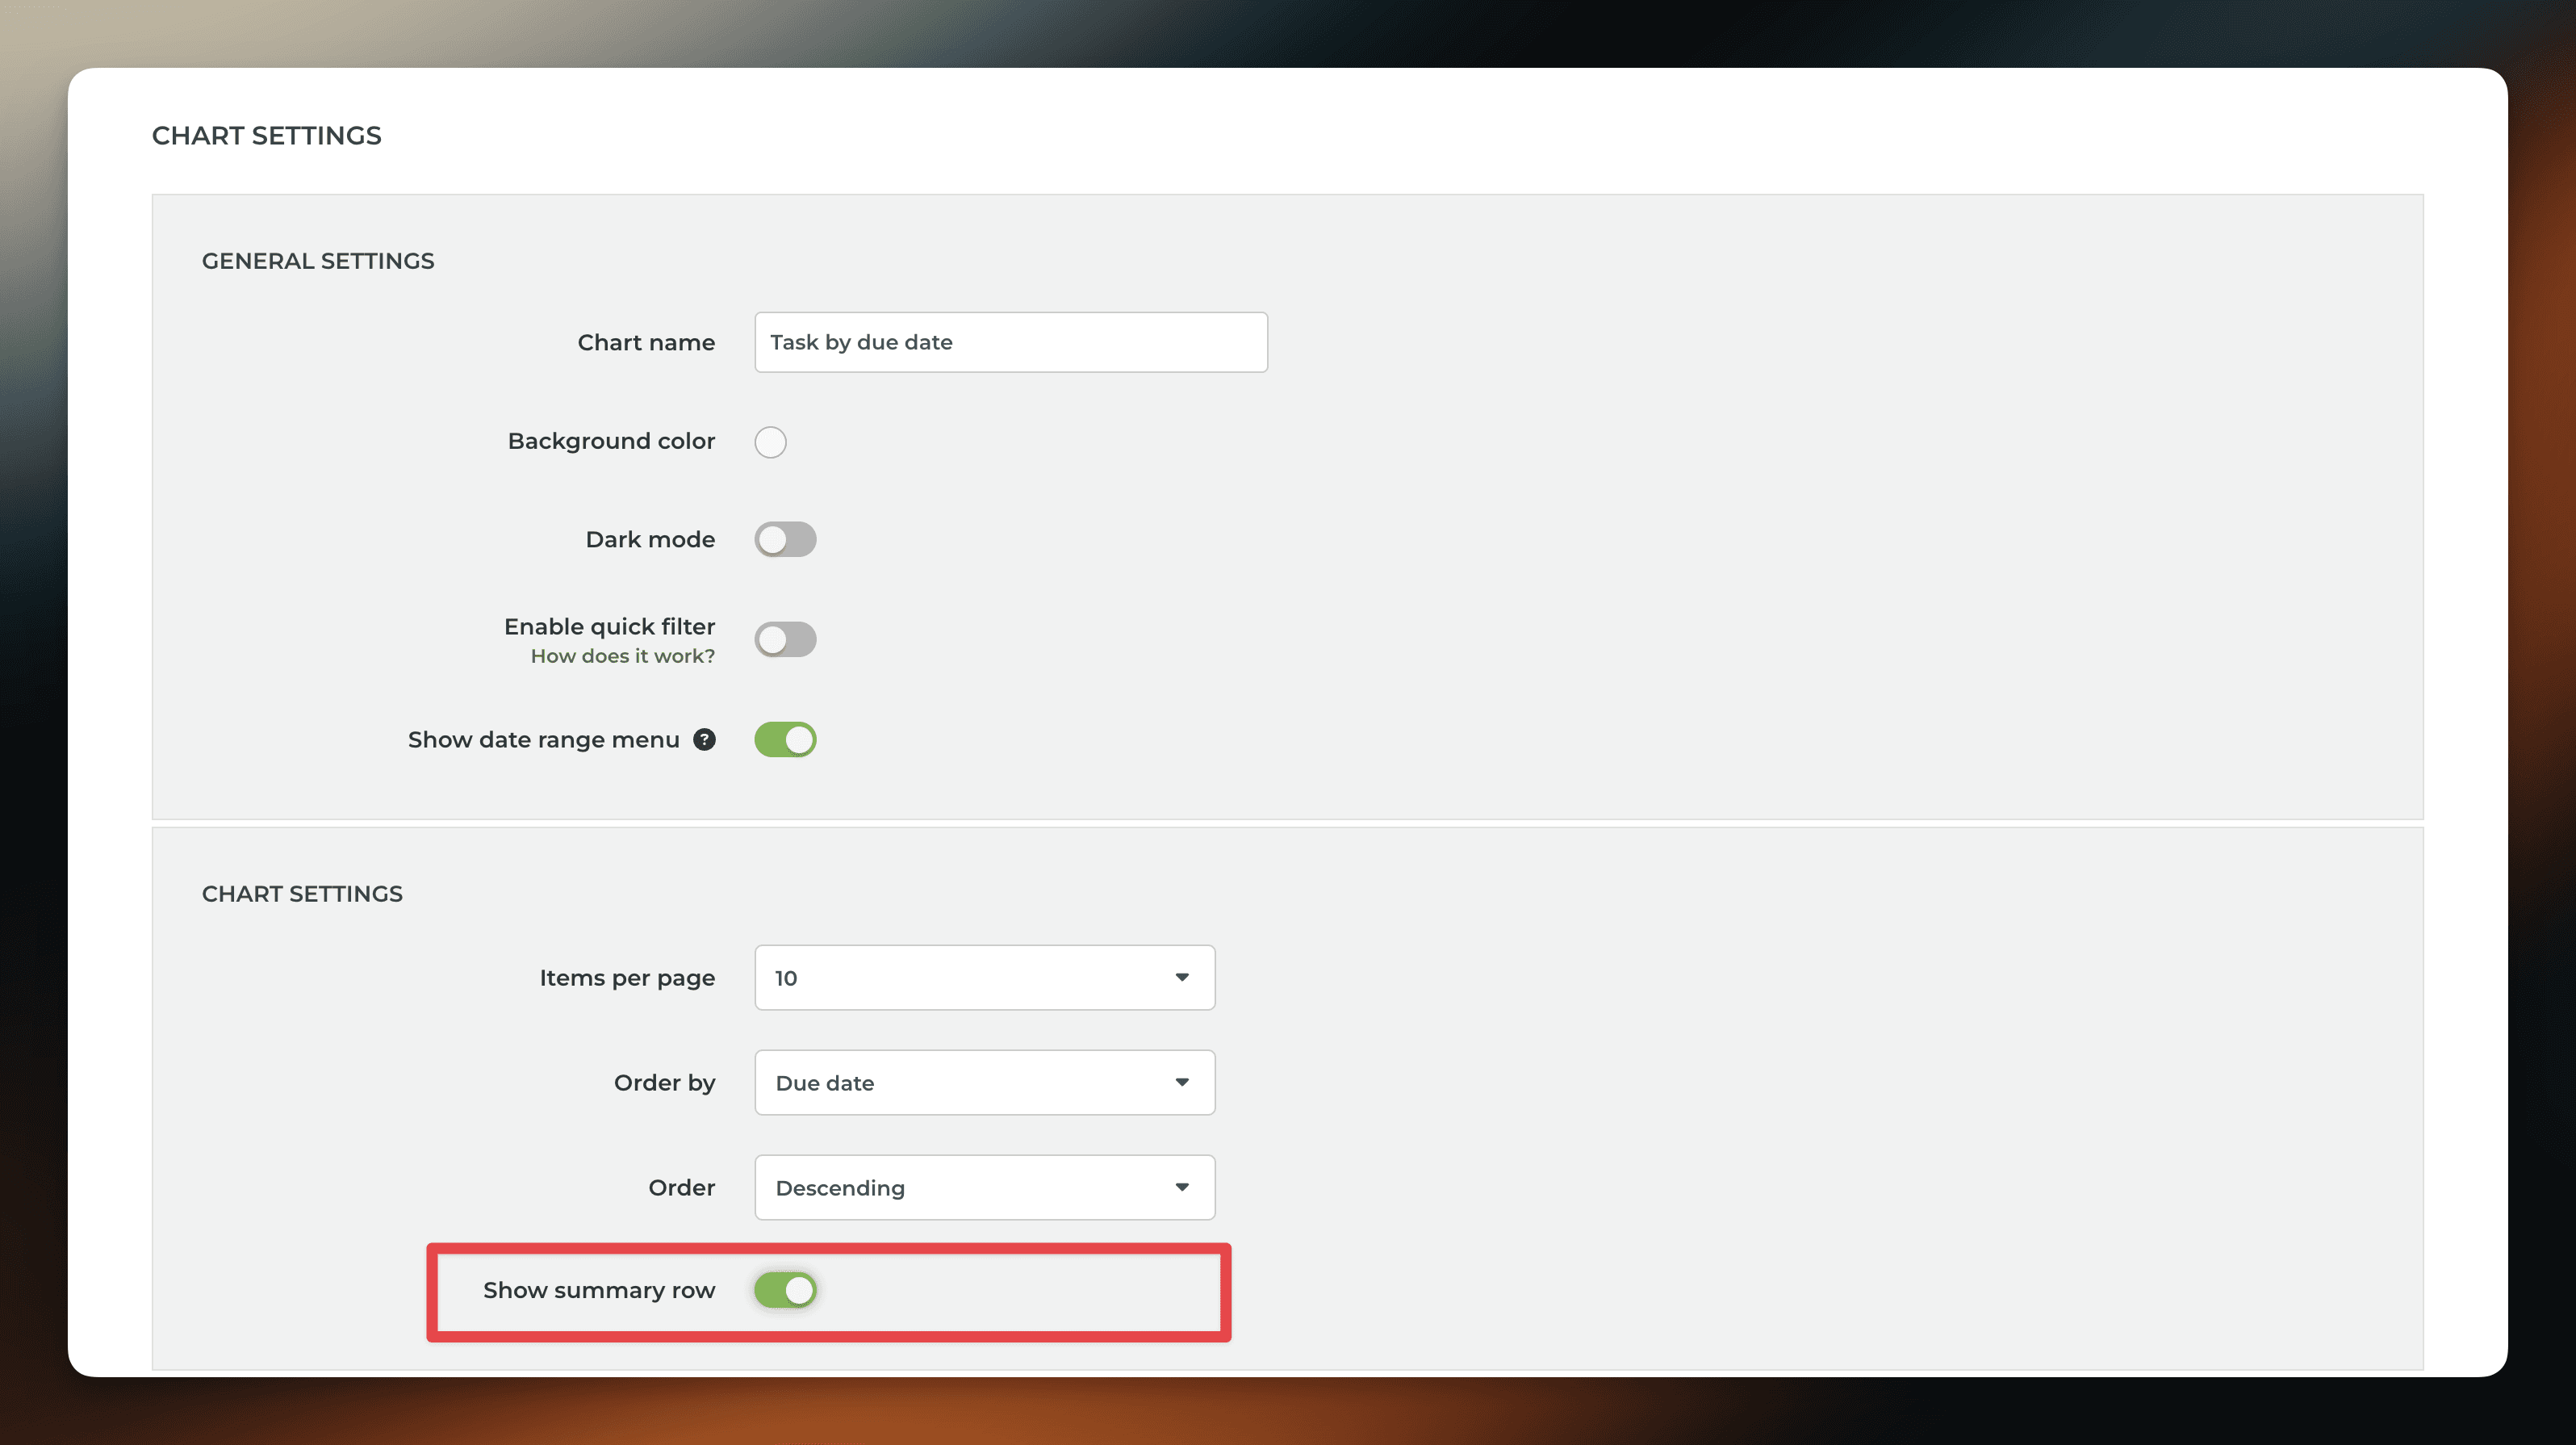
In the Chart settings, you can also configure the type of summary for each column to be either sum, average, or median.
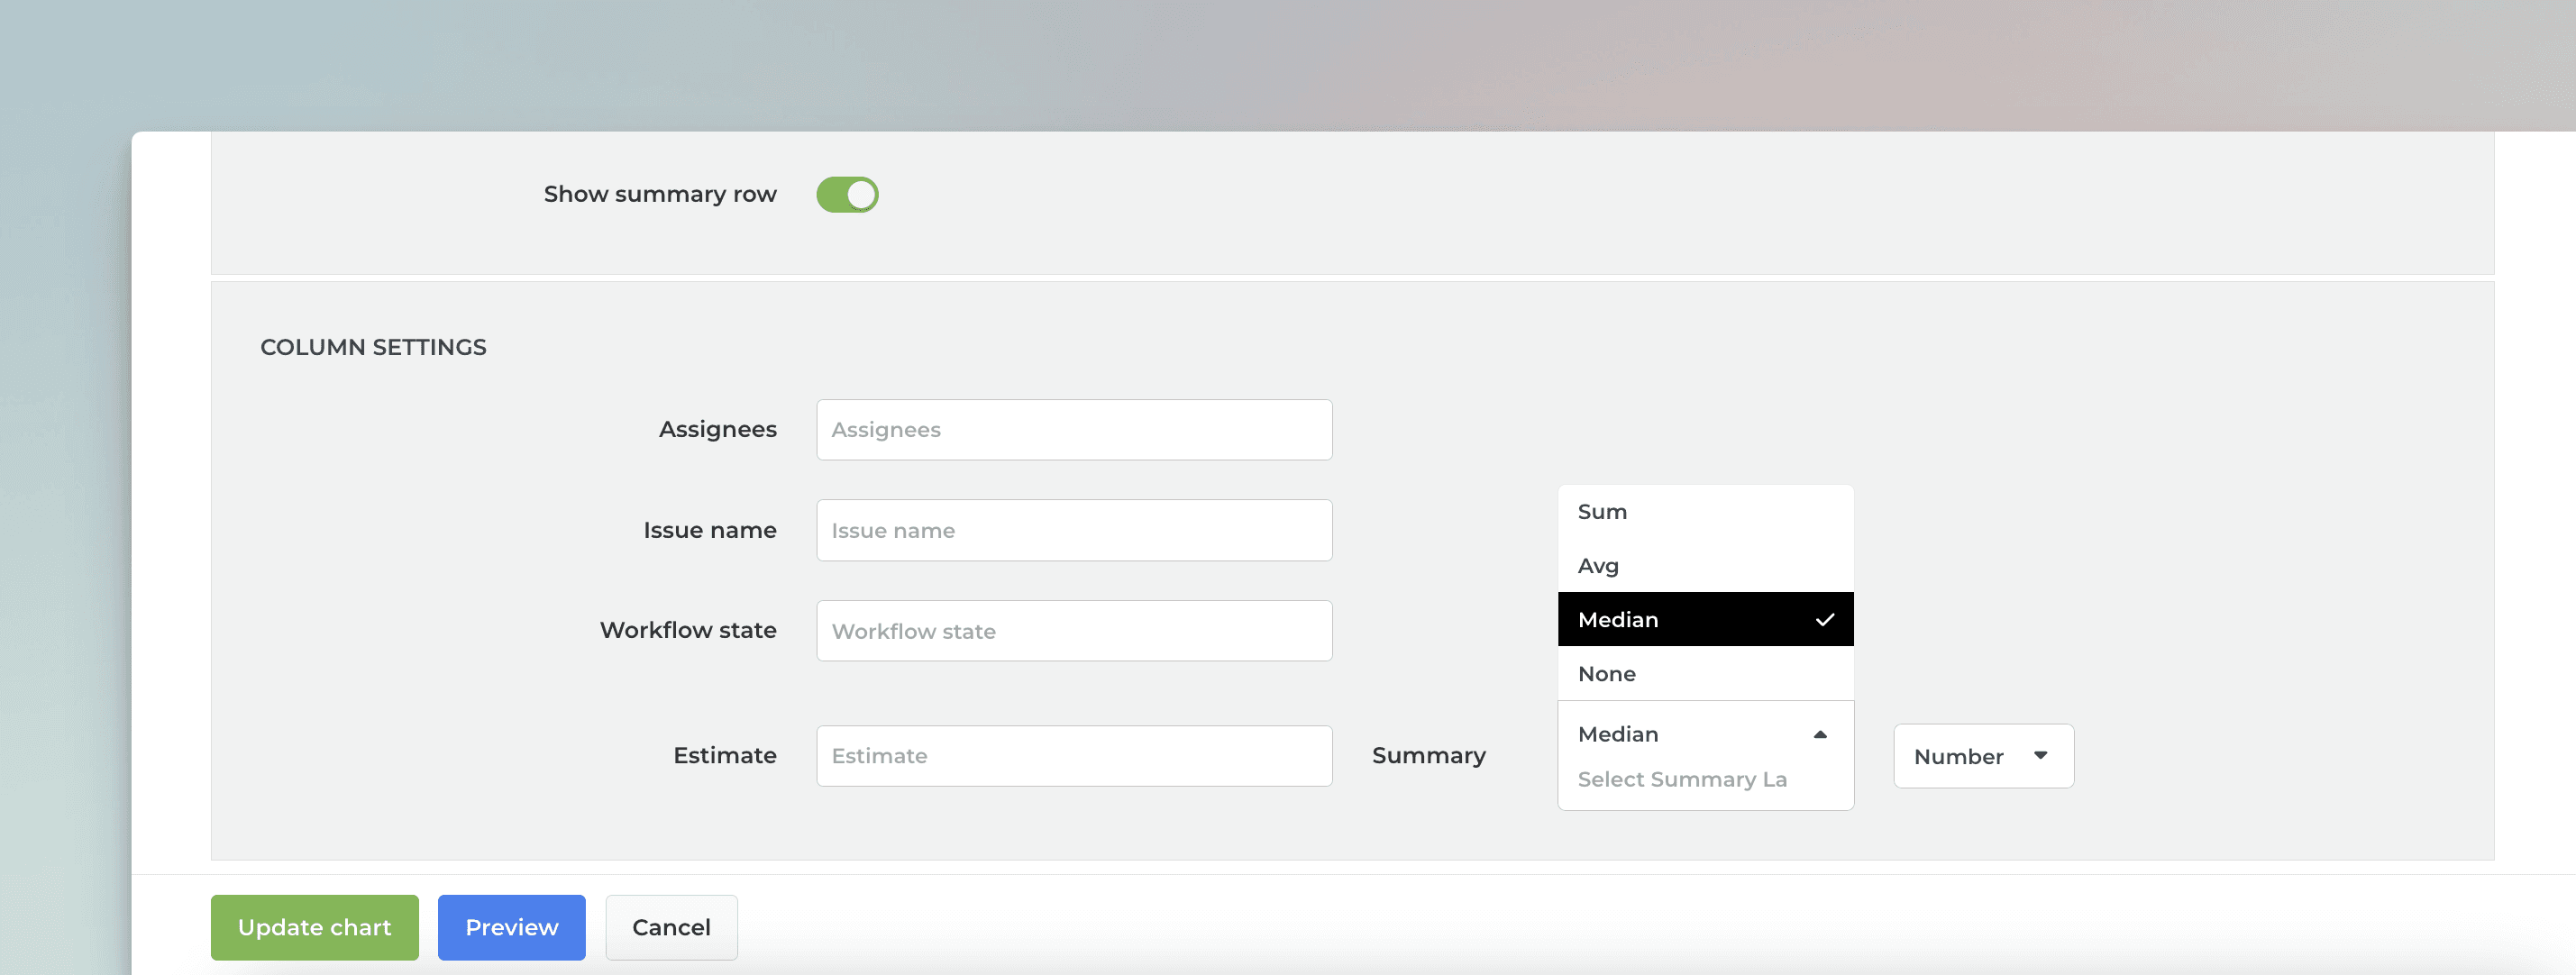
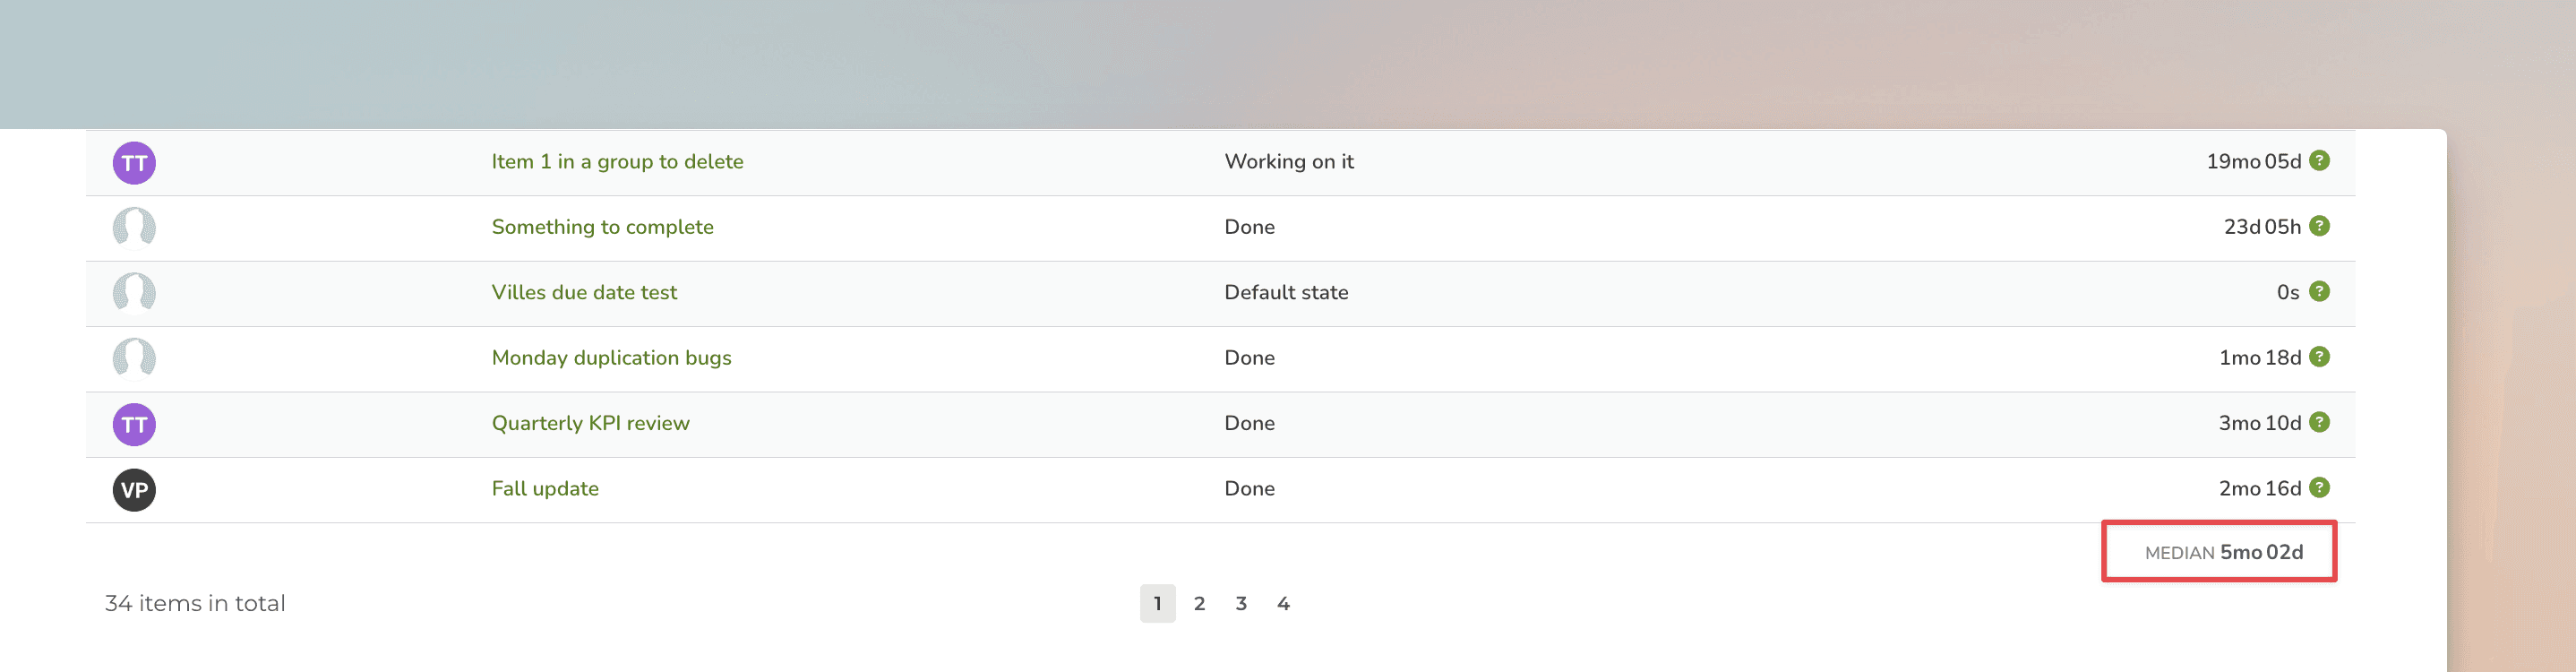
When you select median from the menu, the summary row will display the median for that column:
Track medians with the Table chart
The Table chart also comes with a summary row that displays the sum, average, or median for each column in the table. You can configure the summary type in the chart settings
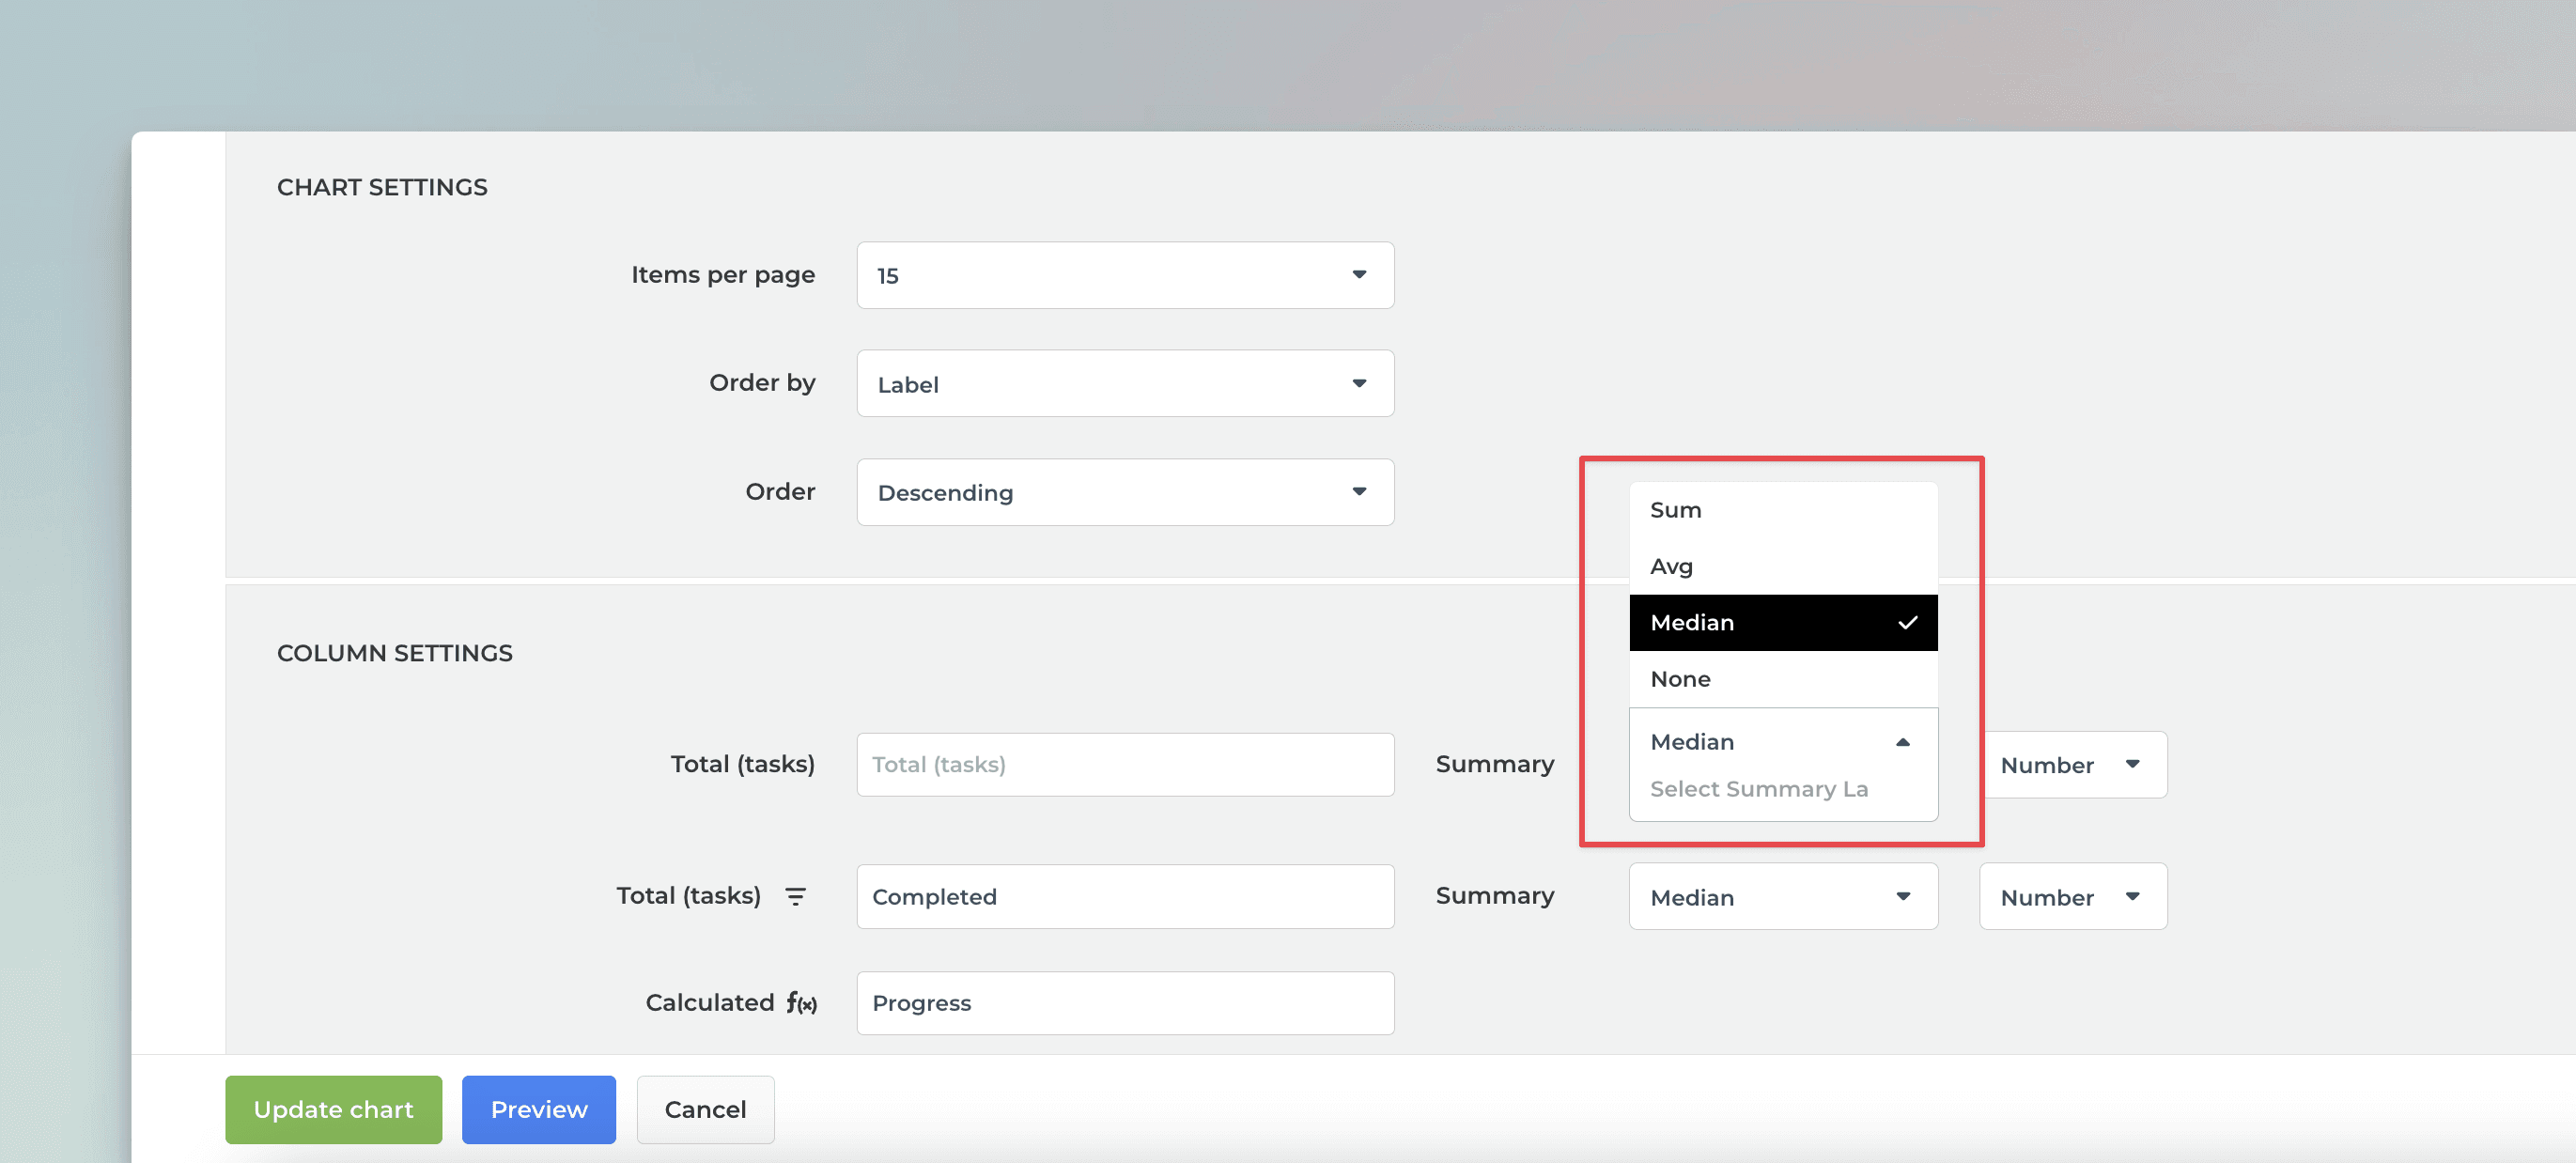
When you select median from the menu, the summary row will display the median for that column:

Unlike in the Task list chart, the summary row in the Table chart is fixed, and there is no setting to toggle it on or off. However, you can configure each column separately, and if you select None, no summary is displayed for that column.
Learn more
Book a free onboarding call
Need help with setting up your charts and reports? Don't find a metric you are looking for? Book a call with our expert. We'd love to help you supercharge your reporting!


