Screenful provides instant charts and reports for your monday.com data, and the tools to configure them according to your board structure. The metrics you can track with Screenful include:
Items and item properties: projects, campaigns, clients, leads, etc.
Track metrics across portfolios
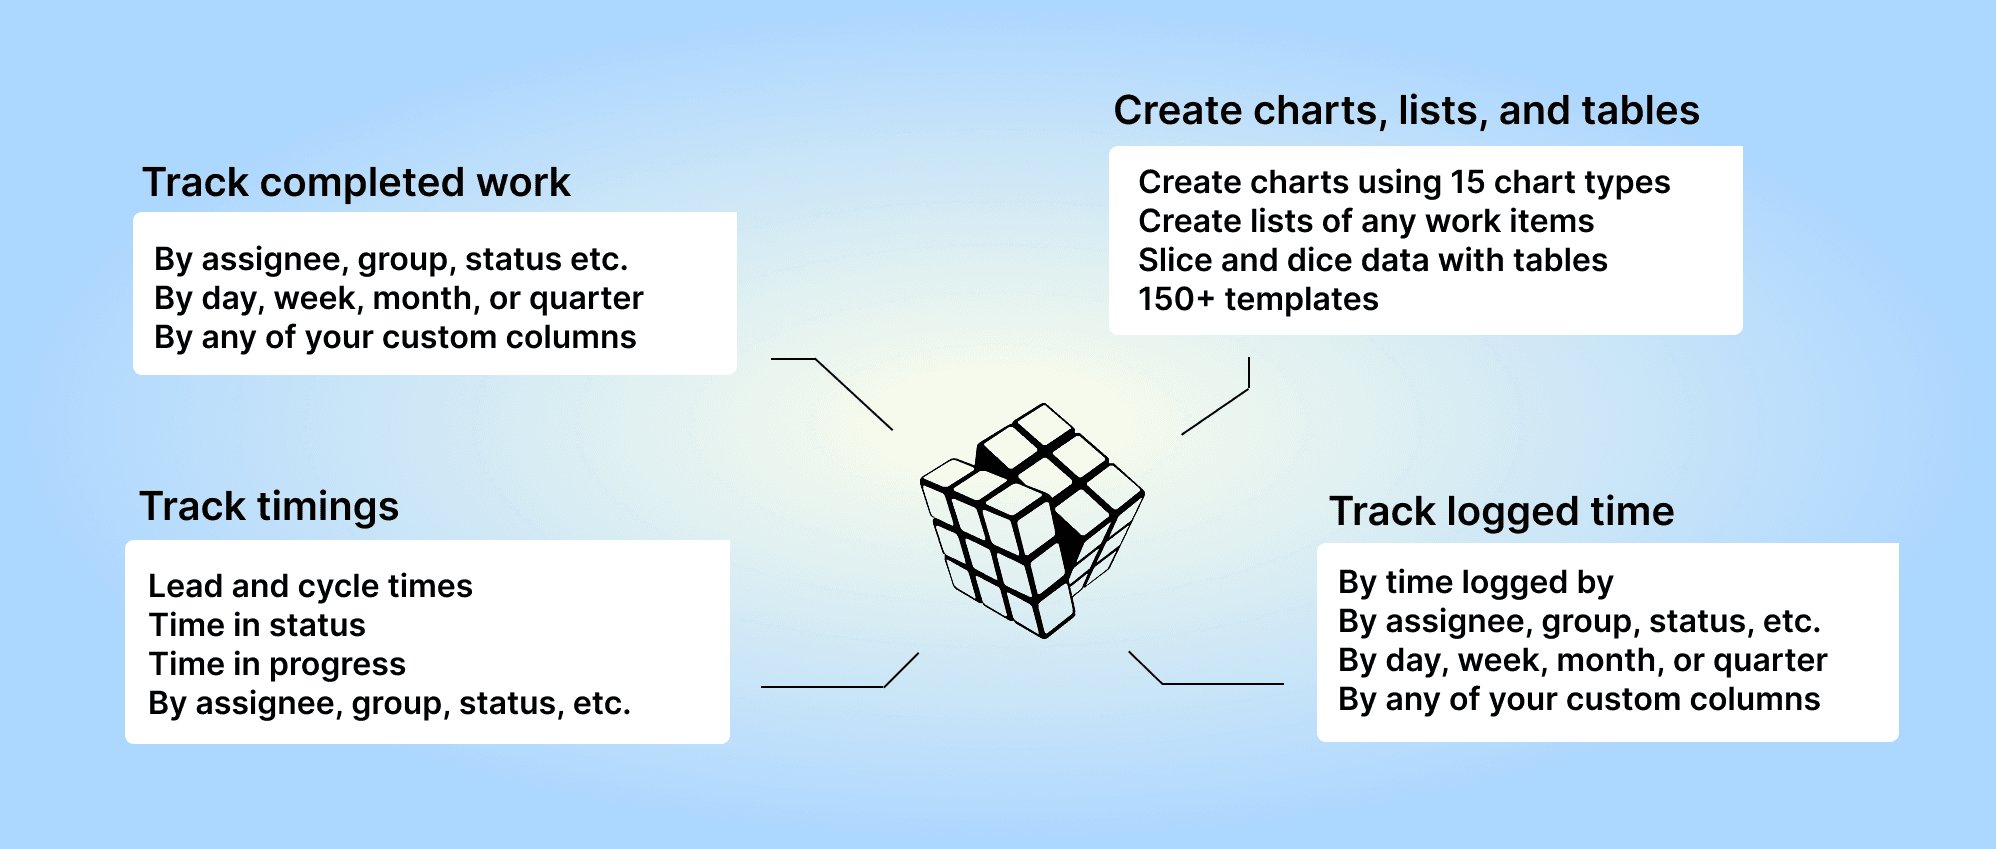
Completed work: progress reporting for a selected time period (velocity).
Due dates and overdue work
Time tracking metrics: hours logged to items within a time period.
Agile metrics with burndowns and cumulative flow diagram
Timing metrics - how long it took to complete a task?
Planned work vs actual
Estimated revenue for the future
And much more ⬇️
See the complete list of units, metrics, and properties supported in our monday.com integration and the comparison to Power BI and EazyBI
You can also track Advanced metrics not available in Monday's native reporting. All metrics mentioned in this guide are available in all Screenful pricing tiers.
Track items and item properties
You can use the Task list chart to track any items on your boards, such as projects, campaigns, clients, leads, etc.:

The columns in the list are configurable, and you can add any property of an item as a column. You can add any of your board columns to the list. Task lists are great when you need to report a specific subset of items based on a property such as assignee, project, or due date.
Here's a guide for creating project status reports using data from monday.com.
Track how much work was completed
The velocity metric measures the amount of work a team completes during a specific period of time. The completed tasks trend shows the trend of different activities over time. You can filter the data by project, assignee, group, etc.

You can track completions by any of your Status columns or by Date columns. Get instant visibility to your velocity metrics. Are you spending more time on meaningful activities and less time on doing rework or fixing bugs?
Learn more about tracking your completed work.
Track hours logged to the tasks
If you have added one or more Time tracking columns to your board, they will be automatically imported and made available for charts. You can create charts based on time tracking data in the same way you create charts based on item data. You have all the same grouping and filtering options available.

You can create time-tracking charts and reports from your top-level tasks, subtasks, or both.
Learn more: Creating charts based on monday.com time tracking data
Track timings: how long it took to complete a task?
See how long it takes to complete a task on average. Track your lead, reaction, and cycle times. See how long tasks stay in each workflow state.

You can see how long a task spent on each workflow state before completion.
Track timing metrics for board sections or any of your custom select fields. Find the bottlenecks in your process to pinpoint areas for improvement. Learn more about the timing metrics.
Track estimated revenue for the future
You can use the Planned Work chart for tracking future revenues based on your data in monday.com. It enables tracking when sales revenue will be recognized based on set dates. You can use it to project the expected revenue based on booked or estimated deals.
Let's assume you have a sales pipeline board that tracks leads and open opportunities. On that board, you have assigned each item an estimated Deal value and an estimated Close date.

You can structure your board any way you want as long as the key information is present:
Deal name
Deal value
Estimated close date
The Planned work chart shows the work with a planned duration. That means a task must have a set date (e.g. due date, close date, or completion date) to be included in this chart.
Once you have imported the board as a data source to Screenful, you can go to the Charts tab and create a Planned work chart from the template. Here's an example chart:

In this example, the chart is grouped by Week, and the bar segment is Salesperson. The chart displays the estimated weekly revenue for each salesperson. The leftmost bar is the current week. The bars to the right are the future weeks.
Learn more: How to track estimated revenue for the future?
Advanced reporting for monday.com
You can go beyond what is possible with Monday's native reporting capabilities. Here are some examples:
Slice and dice your Monday data by any dimension with advanced filters
Create charts with a prompt and ask questions about your data using the AI assistant.
Analyze your data with the Table chart with formulas.
Multi-line chart, Stacked bar, and Multibar charts with clickthroughs
Compare multiple custom fields in a single chart
Track time logged per user (the person who entered the time) within a specified date range
Track lead & cycle time with the Scatter plot chart. You can specify working days & hours in the settings
Track time in status to detect bottlenecks in your workflow
Get data-driven forecasts based on your team's past velocity with the Forecasting chart
Automate the project status reporting with scheduled reports
Export data in CSV or JSON
About Screenful
Screenful provides AI-assisted analytics for data in monday.com. You can slice & dice your data with 15 different chart types and click through to drill into details.
Analytics & Reports by Screenful can be installed via the monday.com Apps Marketplace. Once installed, it adds an entry to the left menu that allows you to access your charts and reports within the Monday UI.
Learn more
Book a free onboarding call
Need help with setting up your charts and reports? Don't find a metric you are looking for? Book a call with our expert. We'd love to help you supercharge your reporting!