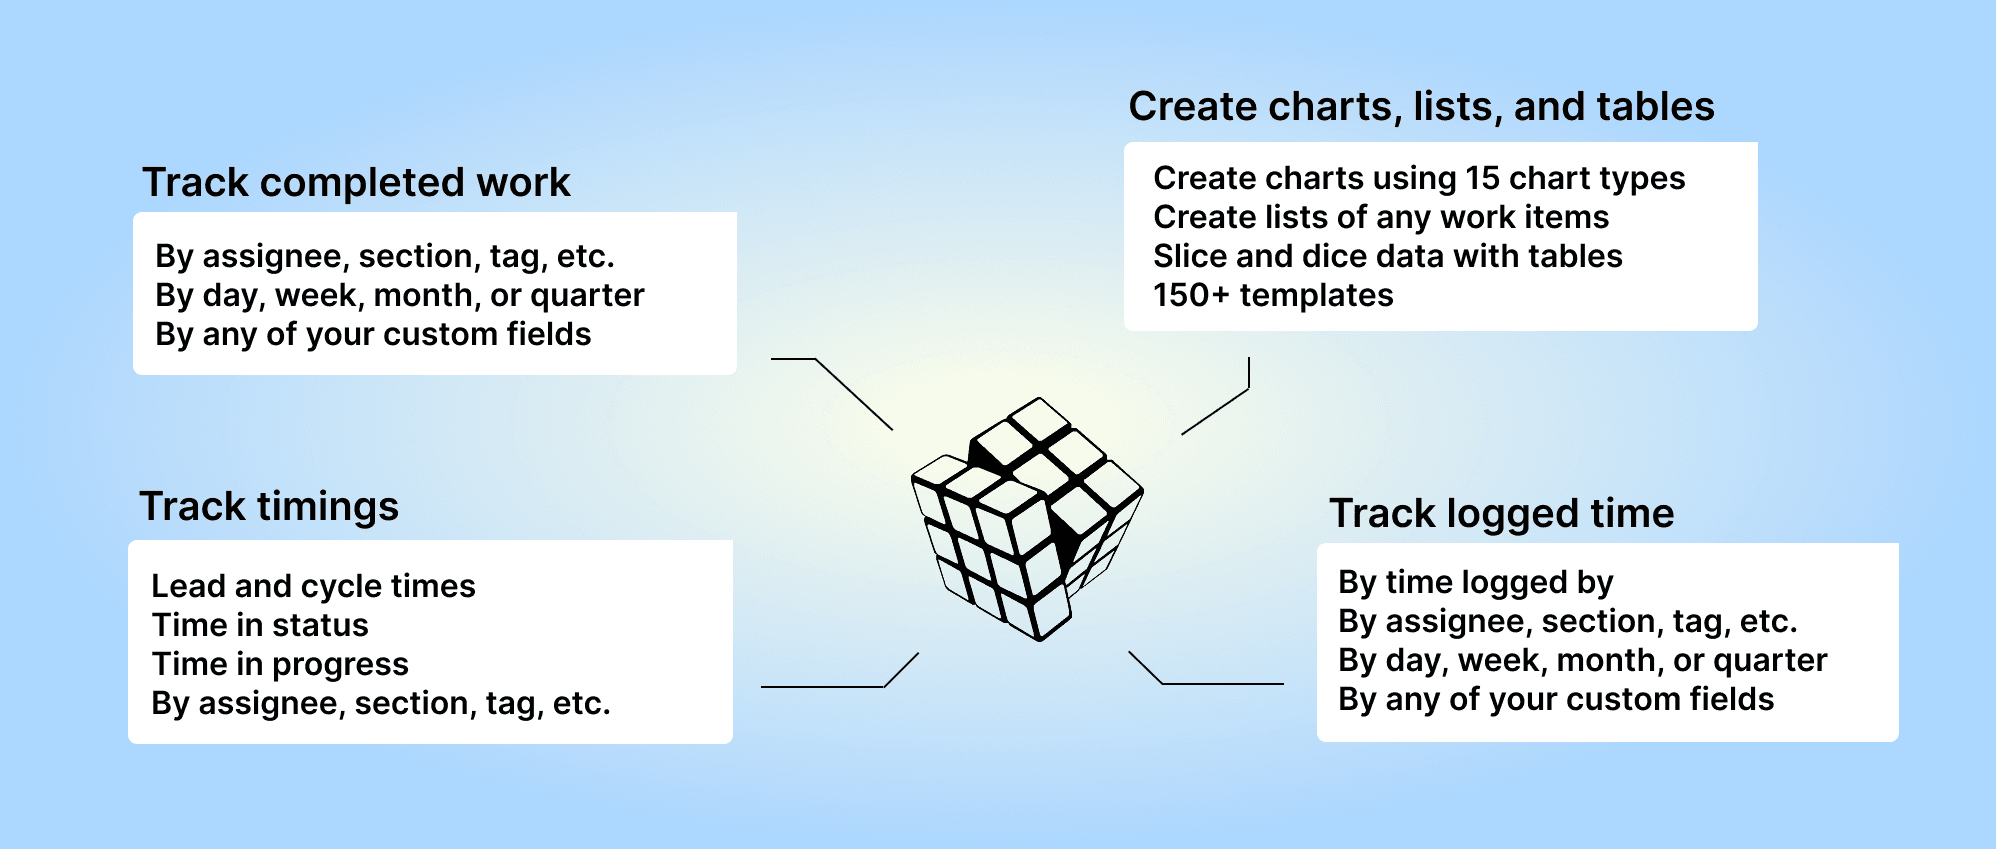
Screenful provides instant charts and reports for Teamwork data, and the tools to configure them according to your board structure. The metrics you can track with Screenful include:
Tasks and task properties: assignees, labels, projects, etc.
Track metrics across projects and workspaces
Custom fields: track any of your custom fields
Completed work: progress reporting for a selected time period (velocity).
Due dates and overdue work
Planned work vs actual
Agile metrics with burndowns and cumulative flow diagram
Time tracking metrics: hours logged to the time tracking fields
Timing metrics - how long it took to complete a task?
And much more ⬇️
See the complete list of units, metrics, and properties supported in our Teamwork integration
You can also track Advanced metrics not available in Teamwork's native reporting. All metrics mentioned in this guide are available in all Screenful pricing tiers.
Track tasks and task properties
You can use the Task list chart to create task lists that can display any task property in a list of tasks:
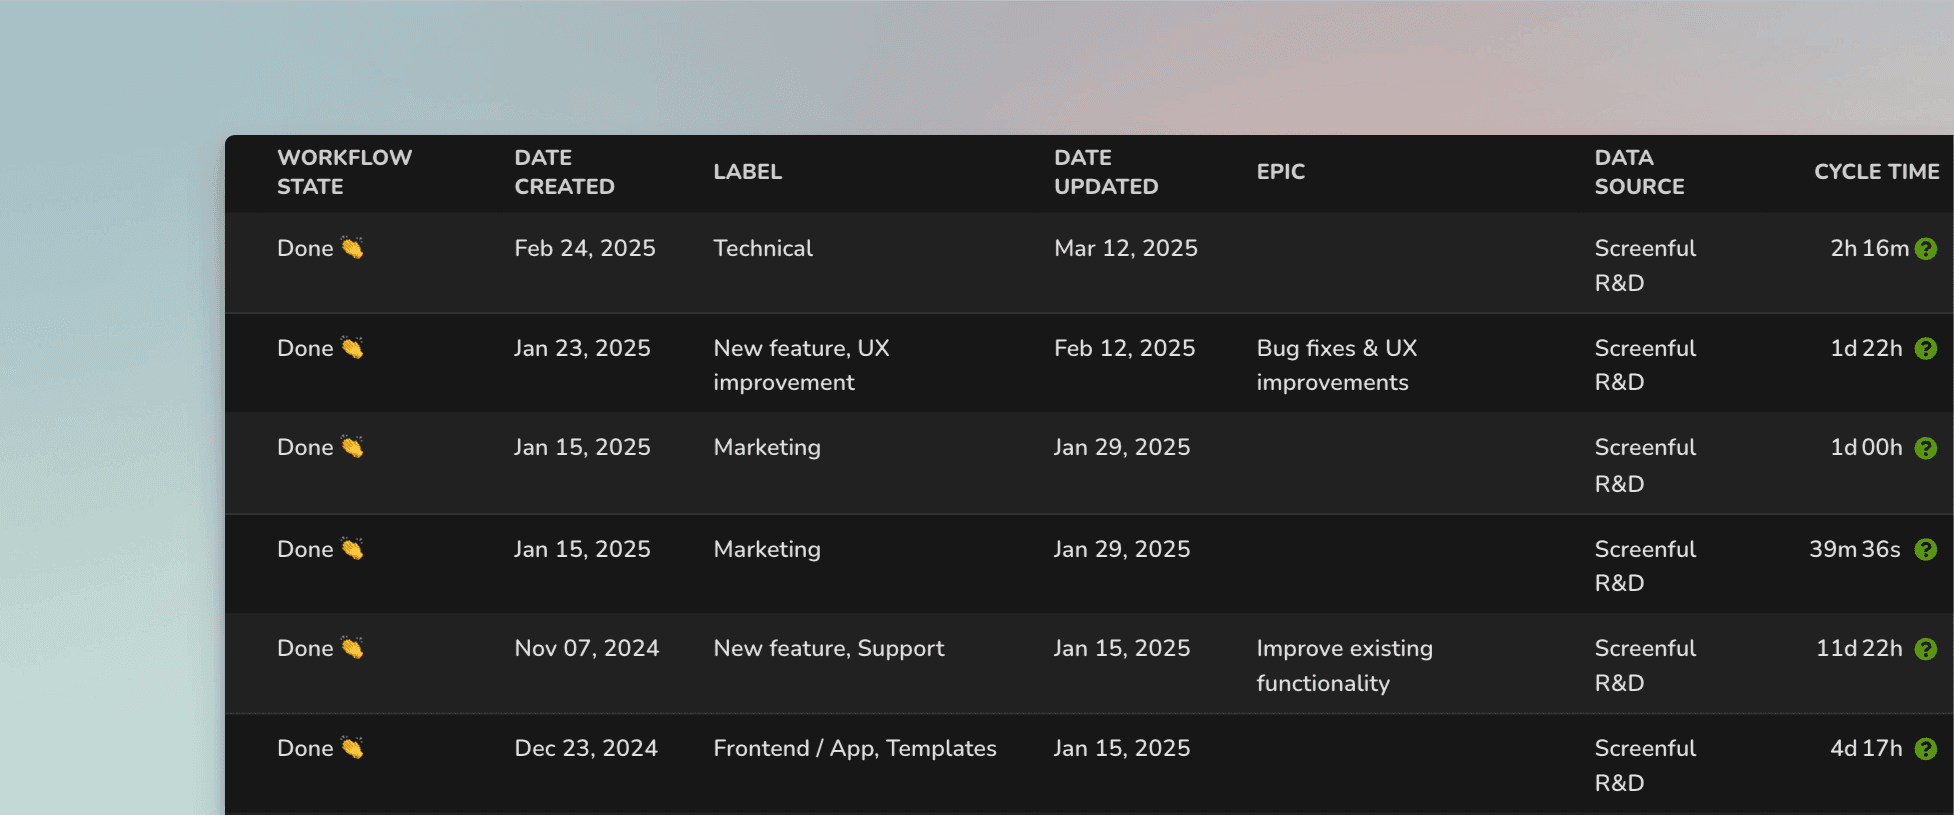
The columns in the list are configurable, and you can add any property of a task as a column. You can add any of your standard or custom fields as columns. Task lists are great when you need to report a specific subset of tasks based on a property such as assignee, project, or due date.
Here's a guide for creating project status reports using data from Teamwork.
Track how much work was completed
The velocity metric measures the amount of work a team completes during a specific period of time. The completed tasks trend shows the trend of different activities over time. You can filter the data by tag, project, folder, etc.
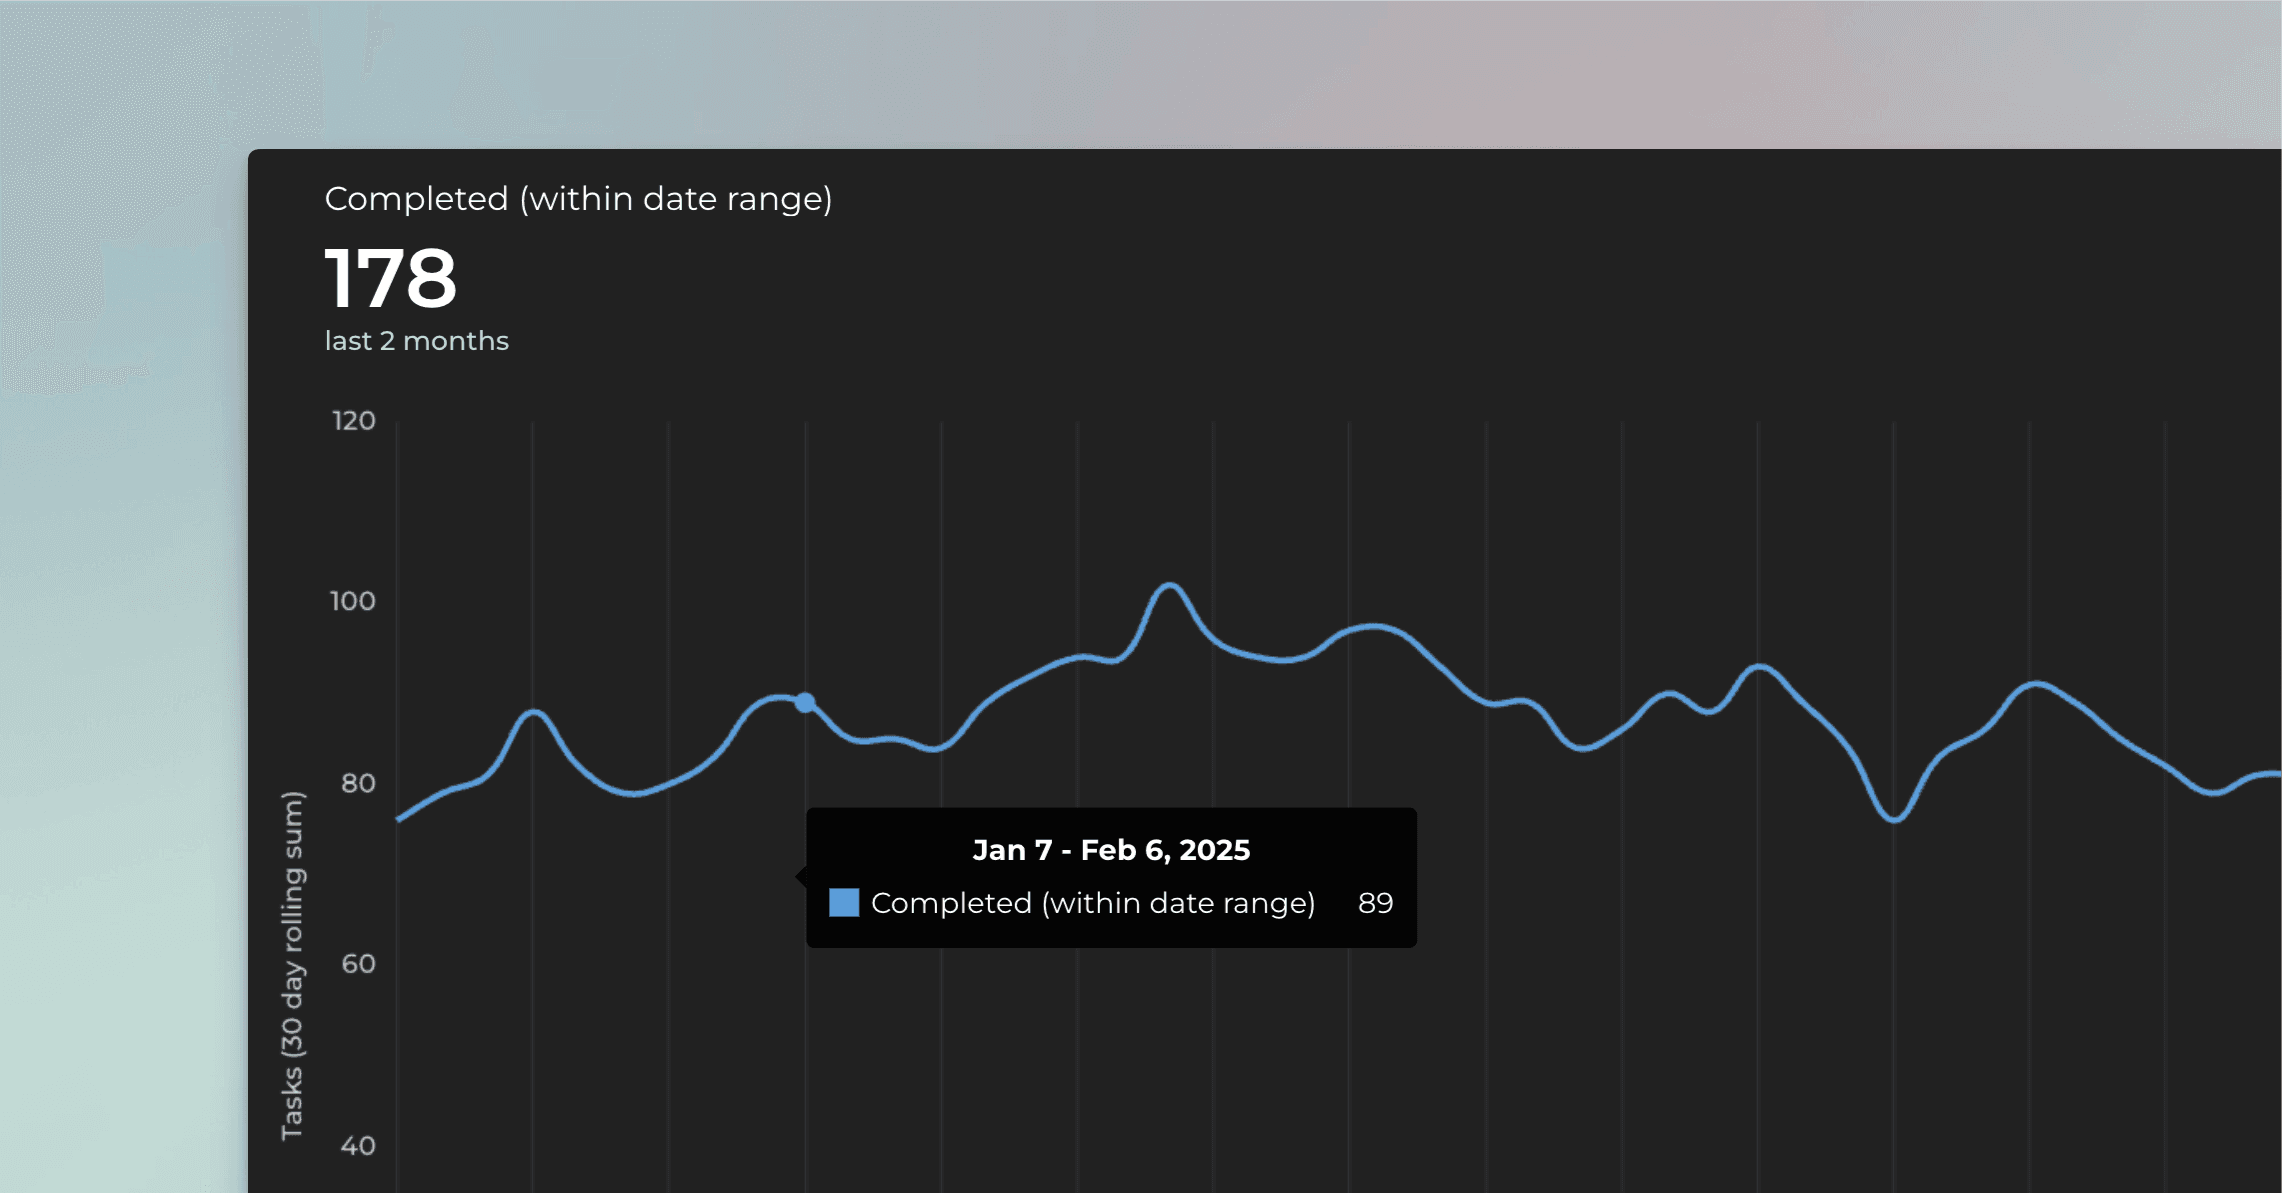
Get instant visibility to your velocity metrics. Are you spending more time on meaningful activities and less time on doing rework or fixing bugs?
Learn more about tracking your completed work.
Track timings: how long it took to complete a task?
See how long it takes to complete a task on average. Track your lead, reaction, and cycle times. See how long tasks stay in each workflow state.
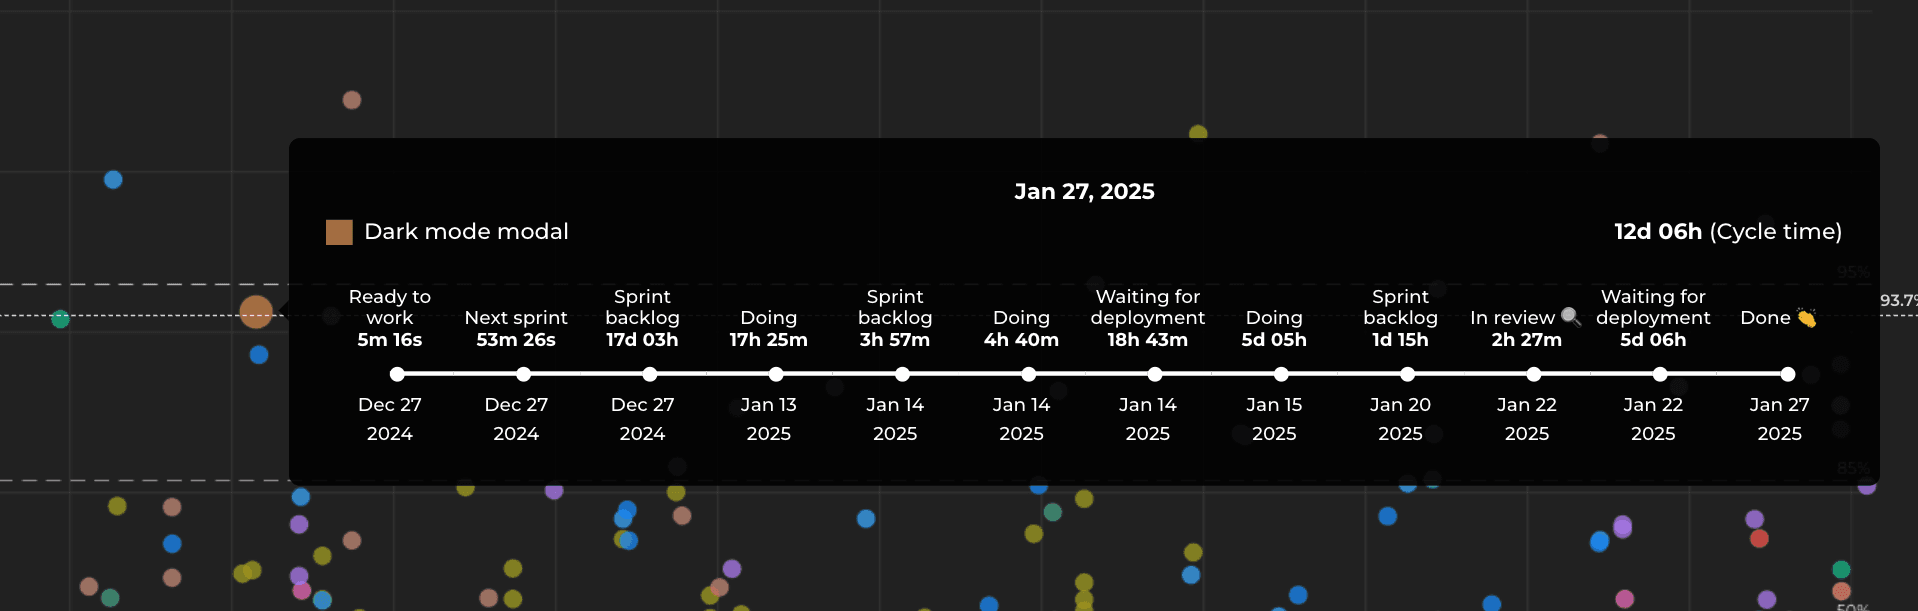
You can see how long a task spent on each workflow state before completion.
Track timing metrics for board sections or any of your custom select fields. Identify bottlenecks in your process and pinpoint areas for improvement. Learn more about the timing metrics.
Track hours logged to the tasks
If you have enabled time tracking on any of your Teamwork projects, the Time estimate and Time spent will be automatically imported and made available for charts.

You can create time-tracking charts and reports from your top-level tasks, subtasks, or both.
Learn more: Creating charts based on Teamwork time tracking data
Advanced reporting for Teamwork
You can go beyond what is possible with Teamwork's native reporting capabilities. Here are some examples:
Slice and dice your Teamwork data by any dimension with advanced filters
Create charts with a prompt and ask questions about your data using the AI assistant.
Analyze your data with the Table chart with formulas.
Multi-line chart, Stacked bar, and Multibar charts with clickthroughs
Compare multiple custom fields in a single chart
Track time logged per user (the person who entered the time) within a specified date range
Track estimated revenue for the future with the Planned work chart
Get data-driven forecasts based on your team's past velocity with the Forecasting chart
Automate the project status reporting with scheduled reports
Export data in CSV or JSON
About Screenful
Screenful provides AI-assisted analytics for data in Teamwork. You can slice & dice your data with 15 different chart types and click through to drill into details.
Learn more
Book a free onboarding call
Need help with setting up your charts and reports? Don't find a metric you are looking for? Book a call with our expert. We'd love to help you supercharge your reporting!